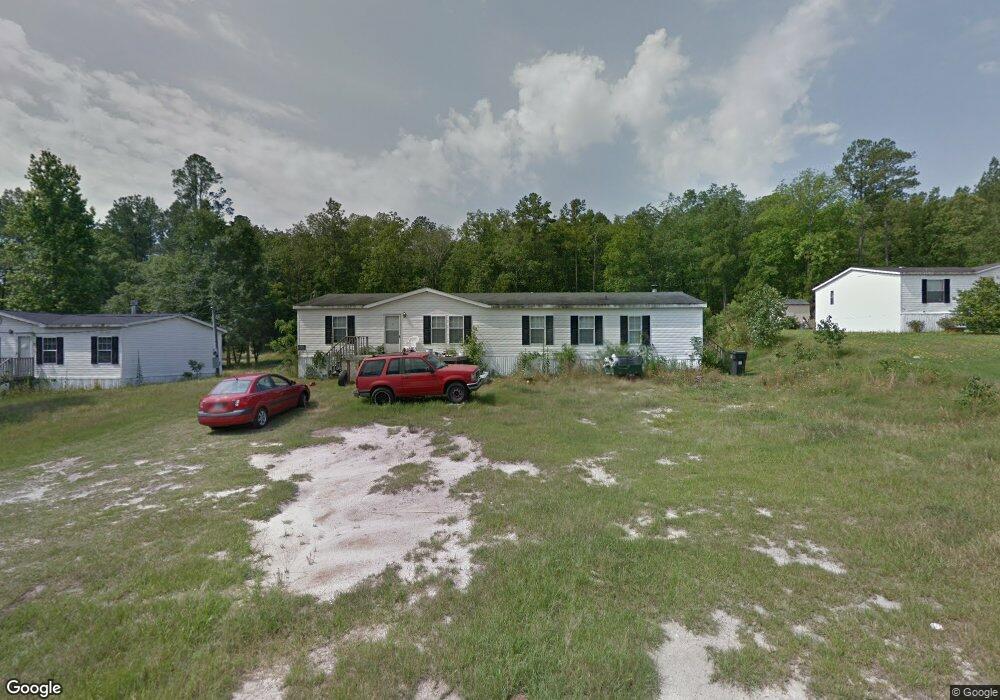
4049 Union Grove Cir Augusta, GA 30906
McDade NeighborhoodEstimated Value: $80,000 - $263,000
3
Beds
2
Baths
1,782
Sq Ft
$101/Sq Ft
Est. Value
About This Home
This home is located at 4049 Union Grove Cir, Augusta, GA 30906 and is currently estimated at $179,904, approximately $100 per square foot. 4049 Union Grove Cir is a home located in Richmond County with nearby schools including Goshen Elementary School, Pine Hill Middle School, and Johnson Magnet.
Ownership History
Date
Name
Owned For
Owner Type
Purchase Details
Closed on
May 11, 2006
Sold by
Federal National Mortgage Association
Bought by
Stevens Conley L and Stevens Stephanie R
Current Estimated Value
Purchase Details
Closed on
May 9, 2002
Sold by
Matheny Daniel P and Matheny P D
Bought by
Dixon Aaron
Home Financials for this Owner
Home Financials are based on the most recent Mortgage that was taken out on this home.
Original Mortgage
$66,000
Interest Rate
7.18%
Purchase Details
Closed on
Nov 6, 2001
Sold by
Matheny D P
Bought by
Thomas Marandel
Home Financials for this Owner
Home Financials are based on the most recent Mortgage that was taken out on this home.
Original Mortgage
$13,050
Interest Rate
11.5%
Mortgage Type
Seller Take Back
Create a Home Valuation Report for This Property
The Home Valuation Report is an in-depth analysis detailing your home's value as well as a comparison with similar homes in the area
Home Values in the Area
Average Home Value in this Area
Purchase History
| Date | Buyer | Sale Price | Title Company |
|---|---|---|---|
| Stevens Conley L | $28,000 | None Available | |
| Dixon Aaron | $13,100 | -- | |
| Thomas Marandel | $14,500 | -- |
Source: Public Records
Mortgage History
| Date | Status | Borrower | Loan Amount |
|---|---|---|---|
| Previous Owner | Dixon Aaron | $66,000 | |
| Previous Owner | Thomas Marandel | $13,050 |
Source: Public Records
Tax History Compared to Growth
Tax History
| Year | Tax Paid | Tax Assessment Tax Assessment Total Assessment is a certain percentage of the fair market value that is determined by local assessors to be the total taxable value of land and additions on the property. | Land | Improvement |
|---|---|---|---|---|
| 2025 | $837 | $20,516 | $4,000 | $16,516 |
| 2024 | $837 | $20,516 | $4,000 | $16,516 |
| 2023 | $321 | $20,788 | $4,000 | $16,788 |
| 2022 | $729 | $19,933 | $4,000 | $15,933 |
| 2021 | $712 | $18,066 | $4,000 | $14,066 |
| 2020 | $698 | $17,853 | $4,000 | $13,853 |
| 2019 | $726 | $17,839 | $4,000 | $13,839 |
| 2018 | $750 | $18,486 | $4,000 | $14,486 |
| 2017 | $757 | $18,778 | $4,000 | $14,778 |
| 2016 | $719 | $17,584 | $4,000 | $13,584 |
| 2015 | $717 | $17,414 | $4,000 | $13,414 |
| 2014 | $727 | $17,695 | $4,000 | $13,695 |
Source: Public Records
Map
Nearby Homes
- 3926 Union Grove Cir
- 3405 Southern Ridge Ct
- 1898 McDade Farm Rd
- 1943 McDade Farm Rd
- 1943 McDade Farm Rd Unit F
- 1894 Mcdade Rd
- 4053 Burning Tree Ln
- 1725 Tamarind Way
- 1737 Tamarind Way
- 4077 Burning Tree Ln
- 2031 Mcdade Rd
- 4015 Goshen Lake Dr S
- 4034 Burning Tree Ln
- 4047 Goshen Lake Dr S
- 4051 Goshen Lake Dr S
- 4149 Markwalter Rd
- 3819 Clanton Rd
- 4038 Goshen Lake Dr S
- 4036 Goshen Lake Dr S
- 4065 Goshen Lake Dr S
- 4047 Union Grove Cir
- 4053 Union Grove Cir
- 4036 Union Grove Cir
- 4045 Union Grove Cir
- 4038 Union Grove Cir
- 4040 Union Grove Cir
- 3806 Hollow Keg Dr
- 4032 Union Grove Cir
- 3808 Hollow Keg Dr
- 4055 Union Grove Cir
- 1939 Mcdade Rd
- 1939 Mcdade Rd
- 3804 Hollow Keg Dr
- 4041 Union Grove Cir
- 4030 Union Grove Cir
- 1903 Mcdade Rd
- 1947 Mcdade Rd
- 4044 Union Grove Cir
- 4039 Union Grove Cir
- 3803 Hollow Keg Dr