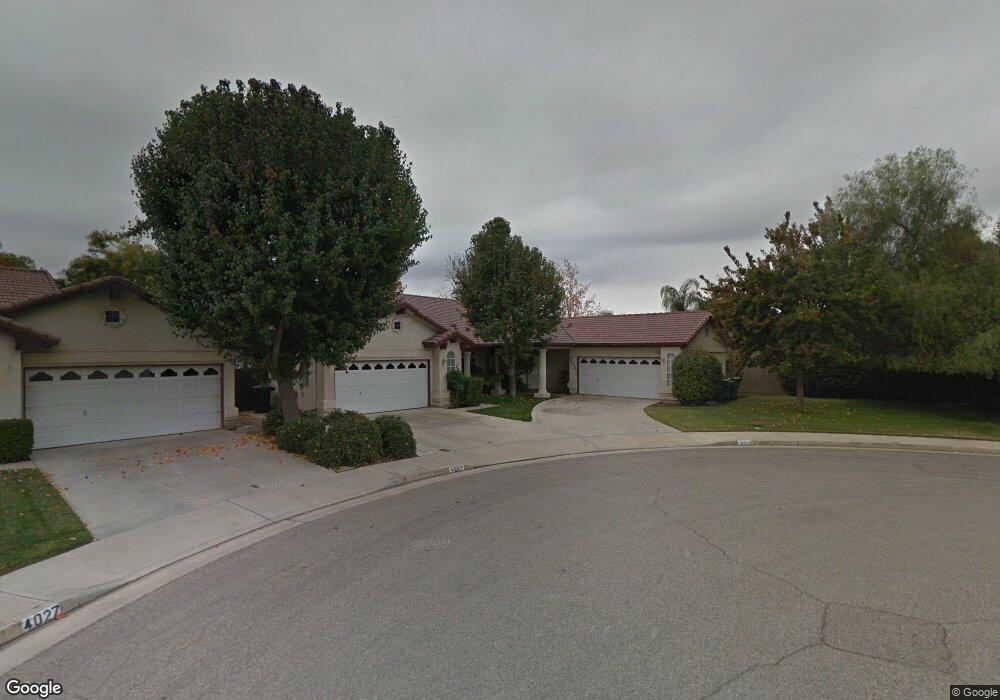
4049 W Hemlock Ct Visalia, CA 93277
Estimated Value: $351,000 - $477,000
2
Beds
2
Baths
1,400
Sq Ft
$277/Sq Ft
Est. Value
About This Home
This home is located at 4049 W Hemlock Ct, Visalia, CA 93277 and is currently estimated at $387,938, approximately $277 per square foot. 4049 W Hemlock Ct is a home located in Tulare County with nearby schools including Crestwood Elementary School, La Joya Middle School, and El Diamante High School.
Ownership History
Date
Name
Owned For
Owner Type
Purchase Details
Closed on
May 27, 2008
Sold by
Lozano Keith
Bought by
Lozano Keith A and The 2007 Keith A Lozano Revocable Trust
Current Estimated Value
Purchase Details
Closed on
May 19, 2004
Sold by
Riddle Ruth Alice
Bought by
Lozano Keith A
Home Financials for this Owner
Home Financials are based on the most recent Mortgage that was taken out on this home.
Original Mortgage
$122,500
Interest Rate
6.09%
Mortgage Type
Purchase Money Mortgage
Purchase Details
Closed on
Apr 18, 1997
Sold by
Guill Harold H
Bought by
Riddle Ruth Alice and The Ruth Alice Riddle Revocable Trust
Purchase Details
Closed on
May 20, 1996
Sold by
Guill Harold H
Bought by
Guill Harold H and Guill Heide H
Purchase Details
Closed on
Feb 10, 1995
Sold by
Osat Inc
Bought by
Guill Harold H and Guill Heidi H
Create a Home Valuation Report for This Property
The Home Valuation Report is an in-depth analysis detailing your home's value as well as a comparison with similar homes in the area
Home Values in the Area
Average Home Value in this Area
Purchase History
| Date | Buyer | Sale Price | Title Company |
|---|---|---|---|
| Lozano Keith A | -- | None Available | |
| Lozano Keith A | $198,500 | Stewart Title Of California | |
| Lozano Keith A | -- | Stewart Title Of California | |
| Riddle Ruth Alice | $165,000 | Chicago Title Co | |
| Guill Harold H | -- | -- | |
| Guill Harold H | $145,000 | Chicago Title Company |
Source: Public Records
Mortgage History
| Date | Status | Borrower | Loan Amount |
|---|---|---|---|
| Previous Owner | Lozano Keith A | $122,500 |
Source: Public Records
Tax History Compared to Growth
Tax History
| Year | Tax Paid | Tax Assessment Tax Assessment Total Assessment is a certain percentage of the fair market value that is determined by local assessors to be the total taxable value of land and additions on the property. | Land | Improvement |
|---|---|---|---|---|
| 2025 | $2,972 | $282,222 | $63,979 | $218,243 |
| 2024 | $2,972 | $276,689 | $62,725 | $213,964 |
| 2023 | $2,890 | $271,265 | $61,496 | $209,769 |
| 2022 | $2,761 | $265,947 | $60,291 | $205,656 |
| 2021 | $2,556 | $241,000 | $60,000 | $181,000 |
| 2020 | $2,374 | $223,000 | $56,000 | $167,000 |
| 2019 | $2,264 | $215,000 | $54,000 | $161,000 |
| 2018 | $2,098 | $200,000 | $50,000 | $150,000 |
| 2017 | $2,030 | $192,000 | $48,000 | $144,000 |
| 2016 | $1,834 | $173,000 | $43,000 | $130,000 |
| 2015 | $1,653 | $183,000 | $46,000 | $137,000 |
| 2014 | $1,653 | $155,000 | $39,000 | $116,000 |
Source: Public Records
Map
Nearby Homes
- 2223 S Julieann St Unit 1032v
- 2346 S Julieann St Unit 1067v
- 3737 W Victor Ave
- 4218 W Redding Ave
- 4105 W Concord Ct
- 4036 W Rialto Ave
- 2650 S Chinowth St
- 3335 W Florence Ave
- 3346 W Good Ave
- 4537 S Ernest St
- 4302 S Chatham St
- 4247 S University St
- 2801 S Kent Ct
- 4301 S University St
- 4523 W Evergreen Ct
- 0 S Silvervale Unit 231829
- 4246 S University St
- 3045 W Victor Ave
- 4228 S Julieann Ct
- 3229 W Loyola Ave
- 4047 W Hemlock Ct
- 4027 W Hemlock Ct
- 4110 S Hemlock
- 4110 W Hemlock Ave
- 4110 W Hemlock Ave
- 4048 W Hemlock Ct
- 4109 W Orchard Ct
- 4046 W Hemlock Ct
- 4028 W Hemlock Ct
- 4011 W Hemlock Ct
- 4120 W Hemlock Ave
- 3349 S Fontana St
- 4111 W Hemlock Ave
- 4119 W Orchard Ct
- 4121 W Hemlock Ave
- 4132 W Hemlock Ave
- 4045 W Orchard Ct
- 3945 W Hemlock Ave
- 4023 W Orchard Ct
- 4129 W Orchard Ct