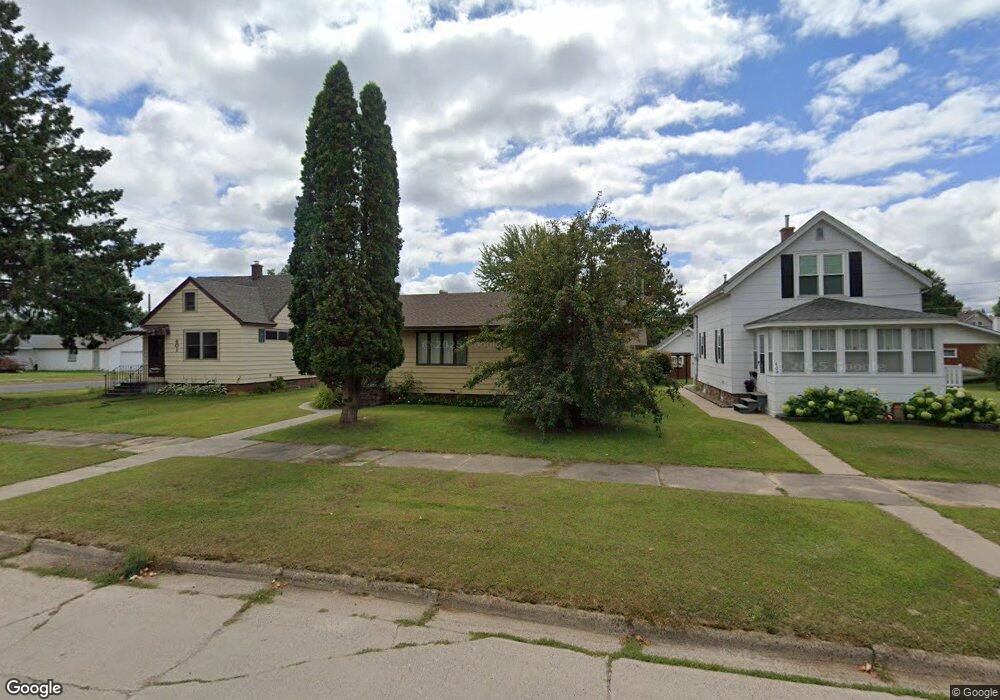
405 10th St NW Chisholm, MN 55719
Estimated Value: $104,119 - $164,000
2
Beds
2
Baths
912
Sq Ft
$146/Sq Ft
Est. Value
About This Home
This home is located at 405 10th St NW, Chisholm, MN 55719 and is currently estimated at $133,280, approximately $146 per square foot. 405 10th St NW is a home located in St. Louis County with nearby schools including Vaughan Elementary School, Chisholm Elementary School, and Chisholm Secondary School.
Ownership History
Date
Name
Owned For
Owner Type
Purchase Details
Closed on
Aug 16, 2006
Sold by
Perkovich Jane and Perkovich Michael
Bought by
Raiter Dennis J and Raiter Tammy J
Current Estimated Value
Home Financials for this Owner
Home Financials are based on the most recent Mortgage that was taken out on this home.
Original Mortgage
$83,538
Outstanding Balance
$49,430
Interest Rate
6.59%
Mortgage Type
Unknown
Estimated Equity
$83,850
Purchase Details
Closed on
Apr 20, 2005
Sold by
Pender Louise M
Bought by
Conger Marilyn L and Lemke Carolyn L
Create a Home Valuation Report for This Property
The Home Valuation Report is an in-depth analysis detailing your home's value as well as a comparison with similar homes in the area
Home Values in the Area
Average Home Value in this Area
Purchase History
| Date | Buyer | Sale Price | Title Company |
|---|---|---|---|
| Raiter Dennis J | $81,900 | All American Title Company | |
| Conger Marilyn L | $32,842 | -- |
Source: Public Records
Mortgage History
| Date | Status | Borrower | Loan Amount |
|---|---|---|---|
| Open | Raiter Dennis J | $83,538 |
Source: Public Records
Tax History Compared to Growth
Tax History
| Year | Tax Paid | Tax Assessment Tax Assessment Total Assessment is a certain percentage of the fair market value that is determined by local assessors to be the total taxable value of land and additions on the property. | Land | Improvement |
|---|---|---|---|---|
| 2024 | $1,926 | $99,600 | $7,200 | $92,400 |
| 2023 | $1,926 | $94,400 | $7,200 | $87,200 |
| 2022 | $1,082 | $73,000 | $5,500 | $67,500 |
| 2021 | $1,138 | $61,000 | $3,300 | $57,700 |
| 2020 | $1,082 | $61,000 | $3,300 | $57,700 |
| 2019 | $1,032 | $61,000 | $3,300 | $57,700 |
| 2018 | $302 | $57,000 | $3,300 | $53,700 |
| 2017 | $240 | $57,000 | $3,300 | $53,700 |
| 2016 | $238 | $51,500 | $5,000 | $46,500 |
| 2015 | $328 | $29,500 | $3,000 | $26,500 |
| 2014 | $328 | $30,500 | $3,000 | $27,500 |
Source: Public Records
Map
Nearby Homes
- 401 10th St NW
- 401 401 Nw 10th St--
- 409 10th St NW
- 415 10th St NW
- 404 9th St NW
- 408 9th St NW
- 331 10th St NW
- 412 9th St NW
- 421 10th St NW
- 406 10th St NW
- 1001 4th Ave NW
- 416 9th St NW
- 408 10th St NW
- 328 9th St NW
- 325 10th St NW
- 414 10th St NW
- 423 10th St NW
- 420 9th St NW
- 1000 4th Ave NW
- 1000 4th Ave NW