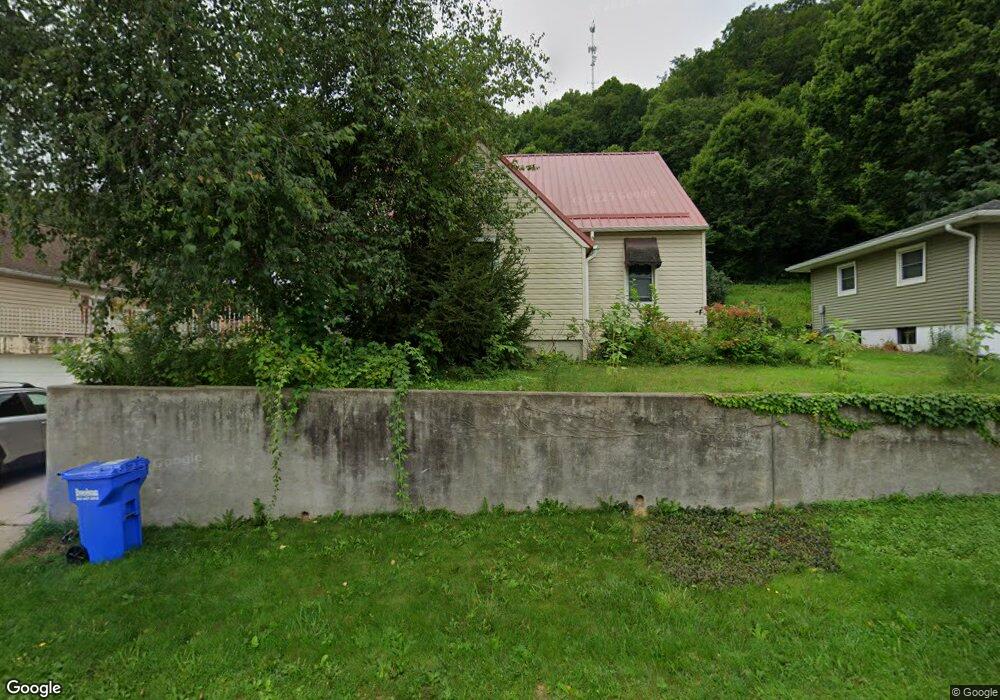
405 2nd St NW Elkader, IA 52043
Estimated Value: $119,000 - $135,806
2
Beds
3
Baths
1,050
Sq Ft
$120/Sq Ft
Est. Value
About This Home
This home is located at 405 2nd St NW, Elkader, IA 52043 and is currently estimated at $126,452, approximately $120 per square foot. 405 2nd St NW is a home located in Clayton County with nearby schools including Central Elementary School and Central Middle School/High School.
Ownership History
Date
Name
Owned For
Owner Type
Purchase Details
Closed on
Oct 26, 2020
Sold by
Krueger James
Bought by
Gibbs Brian and Yaddof Emily
Current Estimated Value
Home Financials for this Owner
Home Financials are based on the most recent Mortgage that was taken out on this home.
Original Mortgage
$68,000
Outstanding Balance
$60,346
Interest Rate
2.9%
Mortgage Type
New Conventional
Estimated Equity
$66,107
Purchase Details
Closed on
Oct 20, 2020
Sold by
Iowa District Court
Bought by
Kroeger James
Home Financials for this Owner
Home Financials are based on the most recent Mortgage that was taken out on this home.
Original Mortgage
$68,000
Outstanding Balance
$60,346
Interest Rate
2.9%
Mortgage Type
New Conventional
Estimated Equity
$66,107
Purchase Details
Closed on
Oct 15, 2018
Sold by
Beck Brian and Beck Alisa M
Bought by
Miller Scott W
Purchase Details
Closed on
Aug 26, 2008
Sold by
Werger Linda L and Werger Kim R
Bought by
Miller April E
Create a Home Valuation Report for This Property
The Home Valuation Report is an in-depth analysis detailing your home's value as well as a comparison with similar homes in the area
Home Values in the Area
Average Home Value in this Area
Purchase History
| Date | Buyer | Sale Price | Title Company |
|---|---|---|---|
| Gibbs Brian | $85,000 | None Available | |
| Kroeger James | -- | None Available | |
| Miller Scott W | $80,000 | -- | |
| Miller April E | $68,300 | None Available |
Source: Public Records
Mortgage History
| Date | Status | Borrower | Loan Amount |
|---|---|---|---|
| Open | Gibbs Brian | $68,000 |
Source: Public Records
Tax History Compared to Growth
Tax History
| Year | Tax Paid | Tax Assessment Tax Assessment Total Assessment is a certain percentage of the fair market value that is determined by local assessors to be the total taxable value of land and additions on the property. | Land | Improvement |
|---|---|---|---|---|
| 2025 | $2,088 | $110,388 | $10,157 | $100,231 |
| 2024 | $1,892 | $93,750 | $8,832 | $84,918 |
| 2023 | $1,762 | $93,750 | $8,832 | $84,918 |
| 2022 | $1,630 | $76,393 | $8,000 | $68,393 |
| 2021 | $1,456 | $76,393 | $8,000 | $68,393 |
| 2020 | $1,456 | $71,561 | $8,000 | $63,561 |
| 2019 | $1,310 | $71,561 | $8,000 | $63,561 |
| 2018 | $1,310 | $66,480 | $8,000 | $58,480 |
| 2017 | $1,354 | $66,480 | $8,000 | $58,480 |
| 2015 | $1,360 | $67,974 | $9,856 | $58,118 |
| 2014 | $1,274 | $67,974 | $9,856 | $58,118 |
Source: Public Records
Map
Nearby Homes
- 301 N 1st St
- 702 N Main St
- 707 N Main St
- 117 S Main St
- 209 2nd St SW
- 302 N 3rd St
- 710 Woodland Dr NW
- 0 E Bridge St
- 26642 Iowa 13
- 247 Franzen Ridge Rd
- 249 Franzen Ridge Rd
- 27766 Highway 13
- 0 13 Hwy Unit NBR20255145
- 14149 Iowa 56
- 27455 Harbor Rd
- 0 Grandview Rd
- TBD Country Rd
- TBD Birch Rd
- 305 S Russell St
- 108 Adams Ct