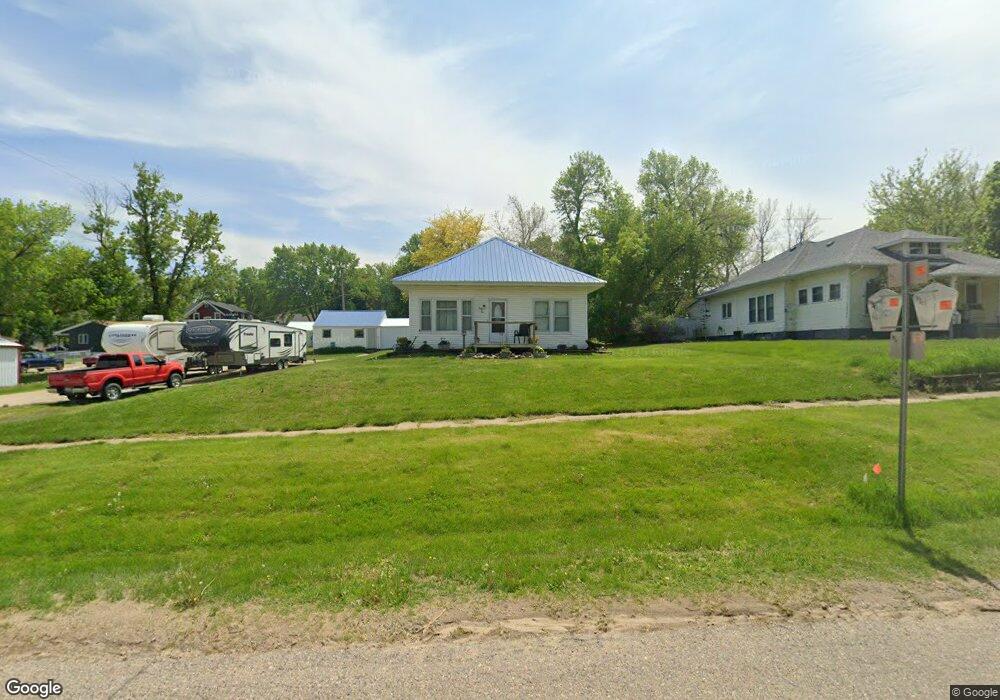
405 3rd St Cushing, IA 51018
Estimated Value: $78,000 - $93,000
3
Beds
1
Bath
1,280
Sq Ft
$68/Sq Ft
Est. Value
About This Home
This home is located at 405 3rd St, Cushing, IA 51018 and is currently estimated at $87,648, approximately $68 per square foot. 405 3rd St is a home with nearby schools including River Valley Elementary School and River Valley Junior/Senior High School.
Ownership History
Date
Name
Owned For
Owner Type
Purchase Details
Closed on
Sep 21, 2006
Sold by
Lewis Todd G
Bought by
Lewis Jamie
Current Estimated Value
Purchase Details
Closed on
Oct 2, 2005
Sold by
Robbins Jennifer L and Aman Jennifer L
Bought by
Lewis Jamie
Home Financials for this Owner
Home Financials are based on the most recent Mortgage that was taken out on this home.
Original Mortgage
$31,000
Interest Rate
6.17%
Mortgage Type
New Conventional
Purchase Details
Closed on
Aug 4, 2004
Sold by
Robbins Bruce D
Bought by
Robbins Jenifer L
Create a Home Valuation Report for This Property
The Home Valuation Report is an in-depth analysis detailing your home's value as well as a comparison with similar homes in the area
Purchase History
| Date | Buyer | Sale Price | Title Company |
|---|---|---|---|
| Lewis Jamie | -- | -- | |
| Lewis Jamie | $31,000 | None Available | |
| Robbins Jenifer L | -- | None Available |
Source: Public Records
Mortgage History
| Date | Status | Borrower | Loan Amount |
|---|---|---|---|
| Previous Owner | Lewis Jamie | $31,000 |
Source: Public Records
Tax History
| Year | Tax Paid | Tax Assessment Tax Assessment Total Assessment is a certain percentage of the fair market value that is determined by local assessors to be the total taxable value of land and additions on the property. | Land | Improvement |
|---|---|---|---|---|
| 2025 | $462 | $59,150 | $4,640 | $54,510 |
| 2024 | $5 | $39,870 | $4,640 | $35,230 |
| 2023 | $470 | $39,870 | $4,640 | $35,230 |
| 2022 | $466 | $32,970 | $4,640 | $28,330 |
| 2021 | $466 | $32,970 | $4,640 | $28,330 |
| 2020 | $428 | $31,390 | $4,970 | $26,420 |
| 2019 | $378 | $31,390 | $4,970 | $26,420 |
| 2018 | $370 | $27,620 | $4,970 | $22,650 |
| 2017 | $370 | $27,620 | $4,970 | $22,650 |
| 2016 | $372 | $27,620 | $0 | $0 |
| 2015 | $518 | $25,810 | $4,640 | $21,170 |
| 2014 | $344 | $25,810 | $4,640 | $21,170 |
Source: Public Records
Map
Nearby Homes
Your Personal Tour Guide
Ask me questions while you tour the home.