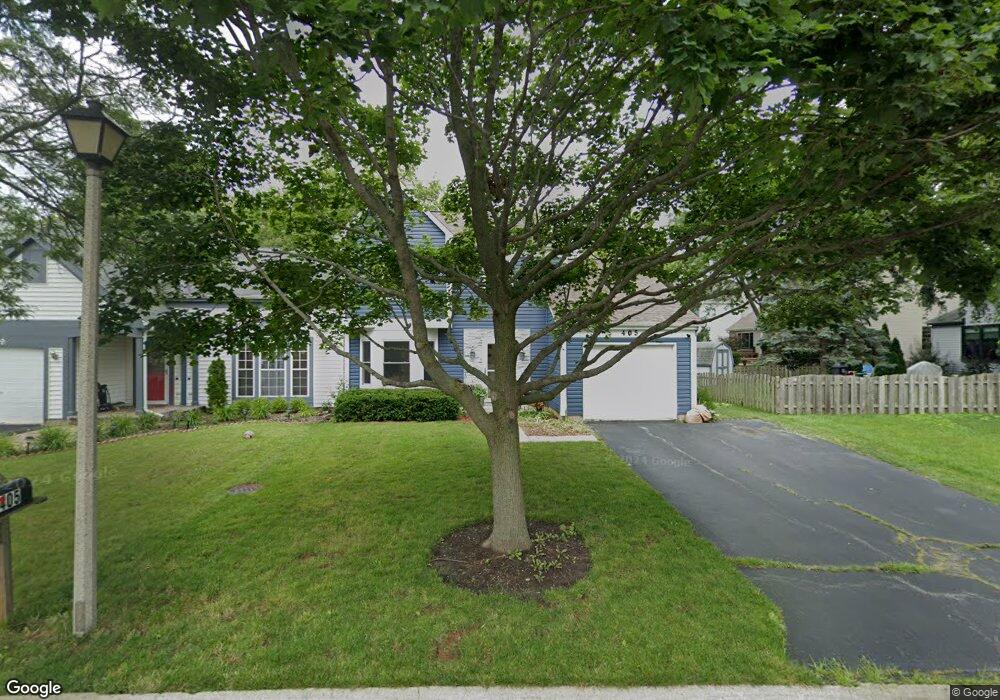
405 Attenborough Way Grayslake, IL 60030
Estimated Value: $219,000 - $320,000
3
Beds
2
Baths
1,562
Sq Ft
$179/Sq Ft
Est. Value
About This Home
This home is located at 405 Attenborough Way, Grayslake, IL 60030 and is currently estimated at $279,789, approximately $179 per square foot. 405 Attenborough Way is a home located in Lake County with nearby schools including Woodland Primary School, Woodland Elementary School, and Woodland Intermediate School.
Ownership History
Date
Name
Owned For
Owner Type
Purchase Details
Closed on
May 25, 2012
Sold by
Brinkman Judith M and Brinkman Elizabeth
Bought by
Brinkman Elizabeth L
Current Estimated Value
Purchase Details
Closed on
Nov 21, 2002
Sold by
Brickman Judith M
Bought by
Brickman Judith M and Brickman Elizabeth L
Purchase Details
Closed on
Jul 2, 2001
Sold by
Lemke Doreen M
Bought by
Brinkman Judith M
Home Financials for this Owner
Home Financials are based on the most recent Mortgage that was taken out on this home.
Original Mortgage
$163,688
Outstanding Balance
$63,356
Interest Rate
7.2%
Mortgage Type
FHA
Estimated Equity
$216,433
Purchase Details
Closed on
Mar 26, 1999
Sold by
Zoia Karen S
Bought by
Lemke Doren M
Home Financials for this Owner
Home Financials are based on the most recent Mortgage that was taken out on this home.
Original Mortgage
$132,873
Interest Rate
6.89%
Mortgage Type
FHA
Purchase Details
Closed on
Jan 6, 1999
Sold by
Zoia Karen S
Bought by
Zoia Karen S and Karen Zoia Trust
Create a Home Valuation Report for This Property
The Home Valuation Report is an in-depth analysis detailing your home's value as well as a comparison with similar homes in the area
Home Values in the Area
Average Home Value in this Area
Purchase History
| Date | Buyer | Sale Price | Title Company |
|---|---|---|---|
| Brinkman Elizabeth L | -- | None Available | |
| Brickman Judith M | -- | -- | |
| Brinkman Judith M | $166,000 | First American Title | |
| Lemke Doren M | $134,000 | Intercounty Title | |
| Zoia Karen S | -- | -- |
Source: Public Records
Mortgage History
| Date | Status | Borrower | Loan Amount |
|---|---|---|---|
| Open | Brinkman Judith M | $163,688 | |
| Previous Owner | Lemke Doren M | $132,873 |
Source: Public Records
Tax History Compared to Growth
Tax History
| Year | Tax Paid | Tax Assessment Tax Assessment Total Assessment is a certain percentage of the fair market value that is determined by local assessors to be the total taxable value of land and additions on the property. | Land | Improvement |
|---|---|---|---|---|
| 2024 | $6,800 | $74,759 | $15,373 | $59,386 |
| 2023 | $6,374 | $68,612 | $14,109 | $54,503 |
| 2022 | $6,374 | $62,613 | $8,941 | $53,672 |
| 2021 | $5,659 | $54,917 | $8,594 | $46,323 |
| 2020 | $5,616 | $52,252 | $8,177 | $44,075 |
| 2019 | $6,446 | $58,716 | $7,845 | $50,871 |
| 2018 | $6,241 | $55,997 | $9,528 | $46,469 |
| 2017 | $6,385 | $55,997 | $8,962 | $47,035 |
| 2016 | $6,102 | $51,691 | $8,273 | $43,418 |
| 2015 | $5,829 | $47,224 | $7,558 | $39,666 |
| 2014 | $4,695 | $38,360 | $8,301 | $30,059 |
| 2012 | $4,703 | $40,062 | $8,669 | $31,393 |
Source: Public Records
Map
Nearby Homes
- 355 Buckingham Dr
- 399 Banbury Ln
- 707 Crossland Dr
- 23 Bobolink Dr
- 745 Dillon Ct
- 873 Essex Cir
- 820 Amelia Ct
- 633 Dove Ct Unit 4
- 1045 Manchester Cir
- 1191 Hummingbird Ln
- 618 Barron Blvd
- 33276 N Sunset Ave
- 418 Flanders Ln
- 20295 W Washington St
- 33336 N Indian Ln
- 1617 Albany St
- 268 Normandy Ln
- 18740 W Willow Point Dr
- 1544 Syracuse Dr
- 33978 N Lake Rd
- 409 Attenborough Way
- 395 Cambridge Dr
- 413 Attenborough Way
- 389 Cambridge Dr
- 417 Attenborough Way
- 383 Cambridge Dr Unit 3
- 410 Attenborough Way Unit 1
- 407 Cambridge Dr
- 421 Attenborough Way
- 414 Attenborough Way
- 377 Cambridge Dr
- 470 Buckingham Dr
- 425 Attenborough Way
- 425 Attenborough Way Unit 425
- 413 Cambridge Dr
- 398 Attenborough Ct
- 474 Buckingham Dr
- 388 Attenborough Ct
- 429 Attenborough Way
- 371 Cambridge Dr