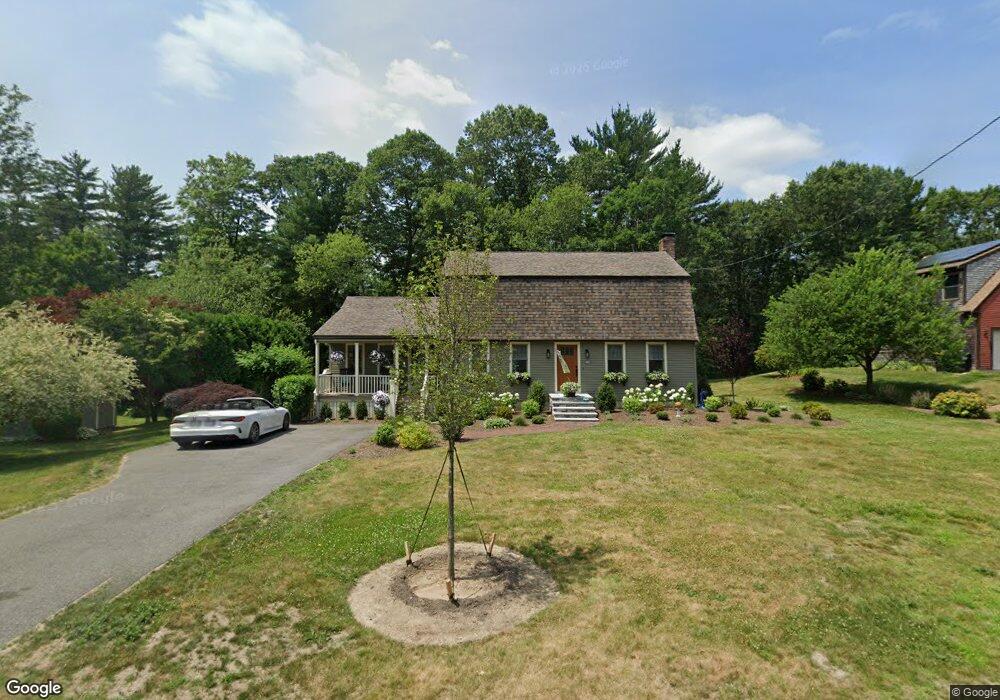
405 Conant St Bridgewater, MA 02324
Estimated Value: $667,000 - $760,000
3
Beds
2
Baths
2,232
Sq Ft
$317/Sq Ft
Est. Value
About This Home
This home is located at 405 Conant St, Bridgewater, MA 02324 and is currently estimated at $706,975, approximately $316 per square foot. 405 Conant St is a home located in Plymouth County with nearby schools including Mitchell Elementary School, Williams Intermediate School, and Bridgewater Middle School.
Ownership History
Date
Name
Owned For
Owner Type
Purchase Details
Closed on
Jul 17, 2001
Sold by
Lebrun Jane E and Lebrun Michael L
Bought by
Lowry Richard E
Current Estimated Value
Purchase Details
Closed on
Dec 9, 1994
Sold by
Pinebridge Rt
Bought by
Lebrun Michael L and Lebrun Jane E
Create a Home Valuation Report for This Property
The Home Valuation Report is an in-depth analysis detailing your home's value as well as a comparison with similar homes in the area
Home Values in the Area
Average Home Value in this Area
Purchase History
| Date | Buyer | Sale Price | Title Company |
|---|---|---|---|
| Lowry Richard E | $309,000 | -- | |
| Lebrun Michael L | $154,000 | -- |
Source: Public Records
Mortgage History
| Date | Status | Borrower | Loan Amount |
|---|---|---|---|
| Open | Lebrun Michael L | $260,000 | |
| Closed | Lebrun Michael L | $260,000 | |
| Closed | Lebrun Michael L | $40,000 |
Source: Public Records
Tax History Compared to Growth
Tax History
| Year | Tax Paid | Tax Assessment Tax Assessment Total Assessment is a certain percentage of the fair market value that is determined by local assessors to be the total taxable value of land and additions on the property. | Land | Improvement |
|---|---|---|---|---|
| 2025 | $6,892 | $582,600 | $196,100 | $386,500 |
| 2024 | $6,755 | $556,400 | $186,700 | $369,700 |
| 2023 | $6,632 | $516,500 | $174,500 | $342,000 |
| 2022 | $6,497 | $453,700 | $153,100 | $300,600 |
| 2021 | $5,915 | $408,500 | $136,700 | $271,800 |
| 2020 | $5,789 | $393,000 | $131,400 | $261,600 |
| 2019 | $5,647 | $380,800 | $131,400 | $249,400 |
| 2018 | $5,423 | $357,000 | $121,600 | $235,400 |
| 2017 | $5,183 | $332,000 | $121,600 | $210,400 |
| 2016 | $4,951 | $318,600 | $119,200 | $199,400 |
| 2015 | $4,978 | $306,500 | $115,700 | $190,800 |
| 2014 | $4,875 | $300,000 | $112,300 | $187,700 |
Source: Public Records
Map
Nearby Homes
- 489 Flagg St
- 0 Flagg St Unit 73421818
- 220 Bedford St Unit D-5
- 1075 South St
- 50 Stephanie Ln
- 35 Leonard St Unit 35
- 29 Leonard St Unit 29
- 317 Water St
- 218 Auburn St
- 130 Maple Ave
- 9 Titicut Ave
- 32 Titicut Ave Unit Lot 48
- 35 Stockbridge Rd
- 41 Titicut Ave
- The Beacon Plan at Duxburrow Estates
- The Nottingham Plan at Duxburrow Estates
- The Lexington Plan at Duxburrow Estates
- The Allcot Plan at Duxburrow Estates
- The Camden Plan at Duxburrow Estates
- The Tacoma Plan at Duxburrow Estates
- 395 Conant St
- 409 Conant St
- 410 Conant St
- 390 Conant St
- 387 Conant St Unit 389
- 396 Conant St
- 361 Flagg St
- 400 Conant St
- 420 Conant St Unit 422
- 42 Flagstone Place
- 5 Vera Dr
- 381 Conant St
- 15 Vera Dr
- 44 Flagstone Place
- 370 Flagg St
- 48 Flagstone Place
- 46 Flagstone Place
- 52 Flagstone Place
- 50 Flagstone Place
- 52 Flagstone Place Unit 52