Estimated Value: $831,561 - $1,358,000
2
Beds
2
Baths
1,308
Sq Ft
$851/Sq Ft
Est. Value
About This Home
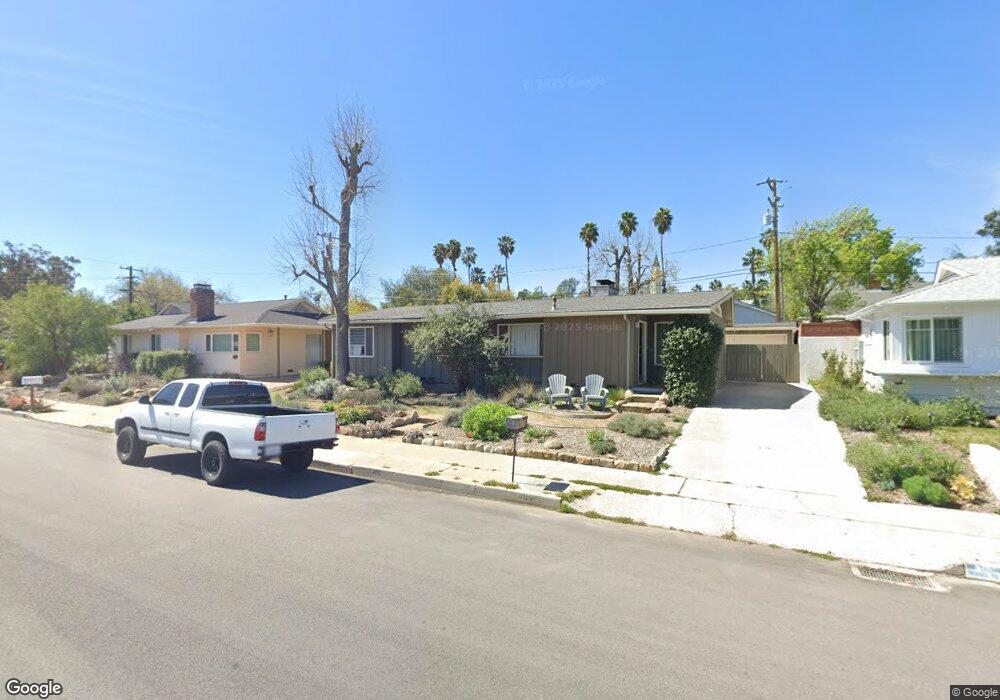
This home is located at 405 Crestview Dr, Ojai, CA 93023 and is currently estimated at $1,112,890, approximately $850 per square foot. 405 Crestview Dr is a home located in Ventura County with nearby schools including Topa Topa Elementary School, Meiners Oaks Elementary School, and Matilija Junior High.
Ownership History
Date
Name
Owned For
Owner Type
Purchase Details
Closed on
Oct 5, 2011
Sold by
Perez Patricia E
Bought by
Perez Patricia E
Current Estimated Value
Home Financials for this Owner
Home Financials are based on the most recent Mortgage that was taken out on this home.
Original Mortgage
$106,000
Interest Rate
3.34%
Mortgage Type
New Conventional
Purchase Details
Closed on
Sep 28, 2011
Sold by
Perez Edward L
Bought by
Perez Patricia E
Home Financials for this Owner
Home Financials are based on the most recent Mortgage that was taken out on this home.
Original Mortgage
$106,000
Interest Rate
3.34%
Mortgage Type
New Conventional
Purchase Details
Closed on
Nov 24, 2008
Sold by
Allen Patricia E and Perez Patricia E
Bought by
Perez Patricia E
Purchase Details
Closed on
Jul 28, 2000
Sold by
Allen Michael J
Bought by
Allen Patricia E
Create a Home Valuation Report for This Property
The Home Valuation Report is an in-depth analysis detailing your home's value as well as a comparison with similar homes in the area
Home Values in the Area
Average Home Value in this Area
Purchase History
| Date | Buyer | Sale Price | Title Company |
|---|---|---|---|
| Perez Patricia E | -- | None Available | |
| Perez Patricia E | -- | Lawyers Title | |
| Perez Patricia E | -- | Lawyers Title | |
| Perez Patricia E | -- | None Available | |
| Allen Patricia E | -- | -- |
Source: Public Records
Mortgage History
| Date | Status | Borrower | Loan Amount |
|---|---|---|---|
| Previous Owner | Perez Patricia E | $106,000 |
Source: Public Records
Tax History
| Year | Tax Paid | Tax Assessment Tax Assessment Total Assessment is a certain percentage of the fair market value that is determined by local assessors to be the total taxable value of land and additions on the property. | Land | Improvement |
|---|---|---|---|---|
| 2025 | $3,620 | $211,194 | $81,221 | $129,973 |
| 2024 | $3,620 | $207,053 | $79,628 | $127,425 |
| 2023 | $3,503 | $202,994 | $78,067 | $124,927 |
| 2022 | $3,477 | $199,014 | $76,536 | $122,478 |
| 2021 | $3,448 | $195,112 | $75,035 | $120,077 |
| 2020 | $3,371 | $193,113 | $74,266 | $118,847 |
| 2019 | $3,284 | $189,327 | $72,810 | $116,517 |
| 2018 | $3,245 | $185,616 | $71,383 | $114,233 |
| 2017 | $3,192 | $181,978 | $69,984 | $111,994 |
| 2016 | $2,781 | $178,411 | $68,612 | $109,799 |
| 2015 | $2,754 | $175,733 | $67,583 | $108,150 |
| 2014 | $2,566 | $172,293 | $66,260 | $106,033 |
Source: Public Records
Map
Nearby Homes
- 300 W Santa Ana St
- 207 S Blanche St
- 203 Foothill Rd
- 212 Foothill Rd
- 203 S Montgomery St
- 408 Canada St
- 0 N Ventura Unit TR25015633
- 211 Fox St
- 10522 62 Creek Rd
- 216 E Aliso St
- 312 Fox St
- 202 N Carrillo Rd Unit E
- 520 Foothill Rd
- 207 E Eucalyptus St
- 203 N Carrillo Rd Unit B
- 203 N Carrillo Rd Unit B
- 1090 Cuyama Rd
- 608 E Ojai Ave
- 741 Saddle Ln
- 201 Drown Ave
- 409 Crestview Dr
- 401 Crestview Dr
- 406 San Antonio St
- 402 San Antonio St
- 408 San Antonio St
- 413 Crestview Dr
- 406 Crestview Dr
- 410 Crestview Dr
- 402 Crestview Dr
- 414 San Antonio St
- 414 Crestview Dr
- 320 Crestview Dr
- 417 Crestview Dr
- 10409 Santa Ana St
- 444 W Santa Ana St
- 466 W Santa Ana St
- 418 San Antonio St
- 404 W Santa Ana St
- 610 Crestview Dr
- 418 Crestview Dr
Your Personal Tour Guide
Ask me questions while you tour the home.