
Landlord's Agent in 2023
Kurt Jain
NextHome Real Estate Services
(203) 685-5878
8 in this area
75 Total Sales
Estimated Value: $156,860 - $187,000
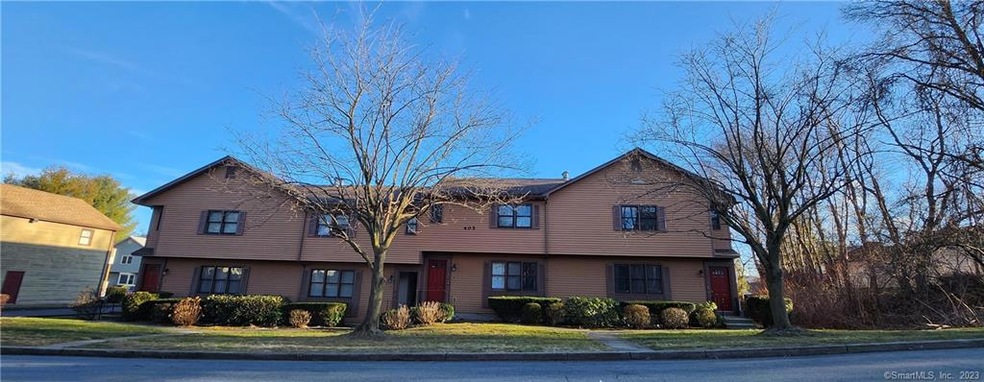
NORTH END 1ST FLOOR. THIS RANCH UNIT FEATURES 1 BEDROOM, 1 BATH, WALK-IN CLOSETS IN BEDROOM. LAUNDRY IN UNIT. DECK , CENTRAL AIR CONDITIONING, GAS HEAT AND LARGE STORAGE AREA IN BASEMENT. RESERVED PARKING. CREDIT, BACKGROUND & EVICTION CHECK REQUIRED!! NO PETS. AVAILABLE 3/1/23. CLOSE TO SHOPPING , MERRITT PARKWAY
| Date | Buyer | Sale Price | Title Company |
|---|---|---|---|
| Cooper Robert | $62,000 | -- | |
| Cooper Robert | $62,000 | -- | |
| Shishko Sarah | $42,500 | -- | |
| Shishko Sarah | $42,500 | -- |
| Date | Event | Price | List to Sale | Price per Sq Ft | Prior Sale |
|---|---|---|---|---|---|
| 03/02/2023 03/02/23 | Rented | $1,500 | +7.1% | -- | |
| 03/02/2023 03/02/23 | Under Contract | -- | -- | -- | |
| 02/13/2023 02/13/23 | For Rent | $1,400 | 0.0% | -- | |
| 10/24/2014 10/24/14 | Sold | $62,000 | 0.0% | $95 / Sq Ft | View Prior Sale |
| 10/13/2014 10/13/14 | For Sale | $62,000 | -- | $95 / Sq Ft |
| Year | Tax Paid | Tax Assessment Tax Assessment Total Assessment is a certain percentage of the fair market value that is determined by local assessors to be the total taxable value of land and additions on the property. | Land | Improvement |
|---|---|---|---|---|
| 2025 | $2,266 | $52,160 | $0 | $52,160 |
| 2024 | $2,266 | $52,160 | $0 | $52,160 |
| 2023 | $2,266 | $52,160 | $0 | $52,160 |
| 2022 | $2,266 | $52,160 | $0 | $52,160 |
| 2021 | $2,266 | $52,160 | $0 | $52,160 |
| 2020 | $2,116 | $39,200 | $0 | $39,200 |
| 2019 | $2,116 | $39,200 | $0 | $39,200 |
| 2018 | $2,131 | $39,200 | $0 | $39,200 |
| 2017 | $2,131 | $39,200 | $0 | $39,200 |
| 2016 | $2,131 | $39,200 | $0 | $39,200 |
| 2015 | $3,691 | $87,470 | $0 | $87,470 |
| 2014 | $3,691 | $87,470 | $0 | $87,470 |
Landlord's Agent in 2023
Kurt Jain
NextHome Real Estate Services
(203) 685-5878
8 in this area
75 Total Sales
Seller's Agent in 2014
Stacey Schwartz
Coldwell Banker Realty
(203) 556-7842
7 in this area
77 Total Sales
Buyer's Agent in 2014
Stacy Pfannkuch
Century 21 AllPoints Realty
(203) 209-4989
6 in this area
184 Total Sales
Source: SmartMLS
MLS Number: 170550245
APN: BRID-002366-000001A-000001
Disclaimer: Certain information contained herein is derived from information provided by parties other than Homes.com. All information provided is deemed reliable, but is not guaranteed to be accurate and should be independently verified.
![]() IDX information is provided exclusively for personal, non-commercial use, and may not be used for any purpose other than to identify prospective properties consumers may be interested in purchasing. Information is deemed reliable but not guaranteed.
IDX information is provided exclusively for personal, non-commercial use, and may not be used for any purpose other than to identify prospective properties consumers may be interested in purchasing. Information is deemed reliable but not guaranteed.