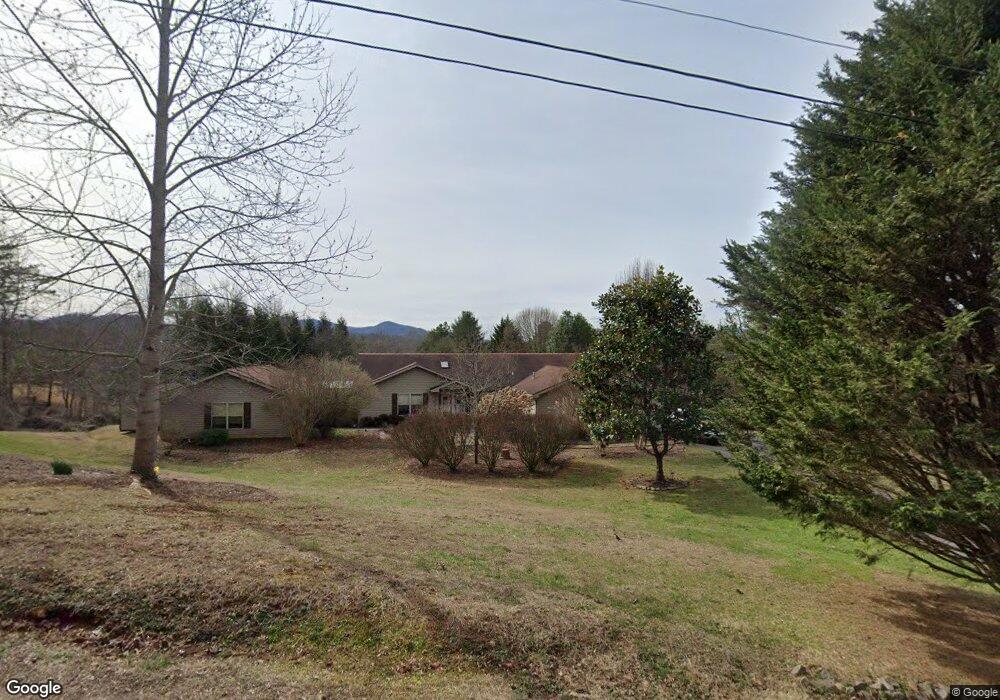
405 Holly Springs Estates Rd Franklin, NC 28734
Estimated Value: $440,000 - $526,000
3
Beds
2
Baths
1,964
Sq Ft
$241/Sq Ft
Est. Value
About This Home
This home is located at 405 Holly Springs Estates Rd, Franklin, NC 28734 and is currently estimated at $472,681, approximately $240 per square foot. 405 Holly Springs Estates Rd is a home located in Macon County with nearby schools including East Franklin Elementary School, Mountain View Intermediate School, and Macon Middle School.
Ownership History
Date
Name
Owned For
Owner Type
Purchase Details
Closed on
Feb 14, 2022
Sold by
Franklin Cemetery Association
Bought by
Poole William
Current Estimated Value
Purchase Details
Closed on
Aug 16, 2006
Sold by
Lee Elden R and Lee Joan C
Bought by
Shope James Gordon and Shope Nancy S
Home Financials for this Owner
Home Financials are based on the most recent Mortgage that was taken out on this home.
Original Mortgage
$268,400
Interest Rate
6.67%
Mortgage Type
New Conventional
Create a Home Valuation Report for This Property
The Home Valuation Report is an in-depth analysis detailing your home's value as well as a comparison with similar homes in the area
Home Values in the Area
Average Home Value in this Area
Purchase History
| Date | Buyer | Sale Price | Title Company |
|---|---|---|---|
| Poole William | $1,000 | R S Jones Jr Jones Key Melvin | |
| Shope James Gordon | -- | None Available | |
| Shope James Gordon | $335,500 | None Available |
Source: Public Records
Mortgage History
| Date | Status | Borrower | Loan Amount |
|---|---|---|---|
| Previous Owner | Shope James Gordon | $268,400 |
Source: Public Records
Tax History Compared to Growth
Tax History
| Year | Tax Paid | Tax Assessment Tax Assessment Total Assessment is a certain percentage of the fair market value that is determined by local assessors to be the total taxable value of land and additions on the property. | Land | Improvement |
|---|---|---|---|---|
| 2025 | $1,540 | $378,900 | $43,250 | $335,650 |
| 2024 | $1,540 | $378,900 | $43,250 | $335,650 |
| 2023 | $1,345 | $378,900 | $43,250 | $335,650 |
| 2022 | $1,345 | $235,170 | $21,690 | $213,480 |
| 2021 | $1,305 | $263,270 | $21,690 | $241,580 |
| 2020 | $1,238 | $263,270 | $21,690 | $241,580 |
| 2018 | $1,192 | $271,770 | $21,210 | $250,560 |
| 2017 | $1,192 | $271,770 | $21,210 | $250,560 |
| 2016 | $1,164 | $271,770 | $21,210 | $250,560 |
| 2015 | $1,141 | $271,770 | $21,210 | $250,560 |
| 2014 | $1,082 | $326,880 | $68,620 | $258,260 |
| 2013 | -- | $326,880 | $68,620 | $258,260 |
Source: Public Records
Map
Nearby Homes
- 00 Holly Springs Mtn Estates
- LOT 5 Sweet Shrub Ln
- 202 Wild Pear Ln Unit 3 & 7A
- 202 Wild Pear Ln
- 60 Ferguson Rd
- 0000 Heathwood Ln Unit 32
- Lot 17 Franklin Farm Rd
- 150 Lauren Ln
- 170 Lauren Ln
- 202 Jackson Heights Dr
- 0 Holly Springs Village Unit 26040670
- 312 Country Rd
- 287 Gregory Rd
- 100 Donna Dr
- 0 Lot 52 & 53 Mountain Cir Unit 26042087
- 1035 Onion Mountain Rd
- 00 Mountain Cir
- 132 Mountain Cir
- 478 Gregory Rd
- 00 Carolina Crest Dr
- 00 Holly Springs Estates Rd
- 28 Holly Springs Estates Rd
- 28 Misty Mountain Rd
- 439 Holly Springs Estates Rd
- 00 Holly Springs Estates Dr
- 560 Holly Springs Estates Rd
- 477 Holly Springs Estates Rd
- 62 Misty Mountain Rd
- 0 Sweet Nectar Ln Unit 43154
- 0 Sweet Nectar Ln Unit 43153
- 0 Sweet Nectar Ln Unit 43152
- 0 Sweet Nectar Ln Unit 43151
- 0 Sweet Nectar Ln
- 0 Sweet Nectar Ln
- 495 Holly Springs Estates Rd
- 115 Sweet Nectar Ln
- 25 Hemlock Trail
- 90 Misty Mountain Rd
- 507 Holly Springs Estates Rd
- 19 Scarlet Oak Dr