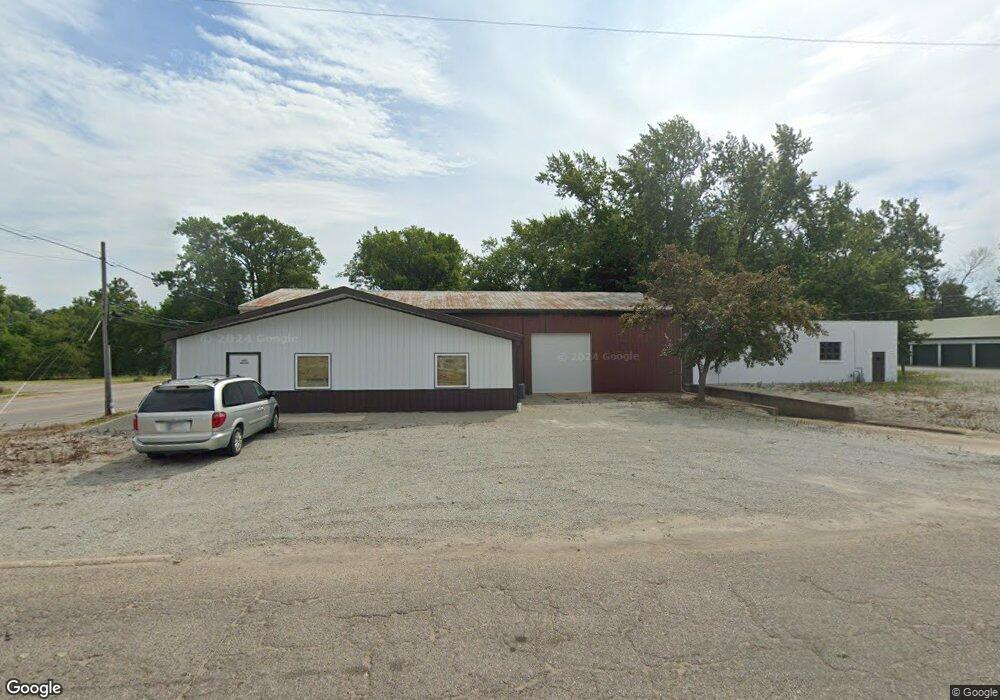
405 Madison St Rochester, IN 46975
Estimated Value: $260,067
--
Bed
--
Bath
5,128
Sq Ft
$51/Sq Ft
Est. Value
About This Home
This home is located at 405 Madison St, Rochester, IN 46975 and is currently estimated at $260,067, approximately $50 per square foot. 405 Madison St is a home located in Fulton County with nearby schools including Columbia Elementary School, George M. Riddle Elementary School, and Rochester Community Middle School.
Ownership History
Date
Name
Owned For
Owner Type
Purchase Details
Closed on
Oct 5, 2021
Sold by
Betcher Daniel L
Bought by
The Revocable Living Trust Of Marylee Mcfarla
Current Estimated Value
Home Financials for this Owner
Home Financials are based on the most recent Mortgage that was taken out on this home.
Interest Rate
3.01%
Purchase Details
Closed on
Jun 27, 2017
Sold by
Michael Barnett
Bought by
Daniel L Betcher
Purchase Details
Closed on
Jun 1, 2010
Sold by
Monte H Hoffman
Bought by
Michael S Barnett
Create a Home Valuation Report for This Property
The Home Valuation Report is an in-depth analysis detailing your home's value as well as a comparison with similar homes in the area
Home Values in the Area
Average Home Value in this Area
Purchase History
| Date | Buyer | Sale Price | Title Company |
|---|---|---|---|
| The Revocable Living Trust Of Marylee Mcfarla | $200,000 | -- | |
| Daniel L Betcher | $55,000 | -- | |
| Michael S Barnett | $117,000 | Fretz Abstract |
Source: Public Records
Mortgage History
| Date | Status | Borrower | Loan Amount |
|---|---|---|---|
| Closed | The Revocable Living Trust Of Marylee Mcfarla | -- |
Source: Public Records
Tax History Compared to Growth
Tax History
| Year | Tax Paid | Tax Assessment Tax Assessment Total Assessment is a certain percentage of the fair market value that is determined by local assessors to be the total taxable value of land and additions on the property. | Land | Improvement |
|---|---|---|---|---|
| 2024 | $1,691 | $77,700 | $31,400 | $46,300 |
| 2023 | $1,628 | $73,900 | $31,400 | $42,500 |
| 2022 | $1,590 | $72,100 | $31,400 | $40,700 |
| 2021 | $1,430 | $59,300 | $31,400 | $27,900 |
| 2020 | $1,431 | $57,200 | $31,400 | $25,800 |
| 2019 | $1,375 | $57,200 | $31,400 | $25,800 |
| 2018 | $1,404 | $57,200 | $31,400 | $25,800 |
| 2017 | $1,343 | $56,900 | $31,400 | $25,500 |
| 2016 | $1,383 | $56,900 | $31,400 | $25,500 |
| 2014 | $1,167 | $56,200 | $31,400 | $24,800 |
| 2013 | $1,167 | $55,600 | $31,400 | $24,200 |
Source: Public Records
Map
Nearby Homes