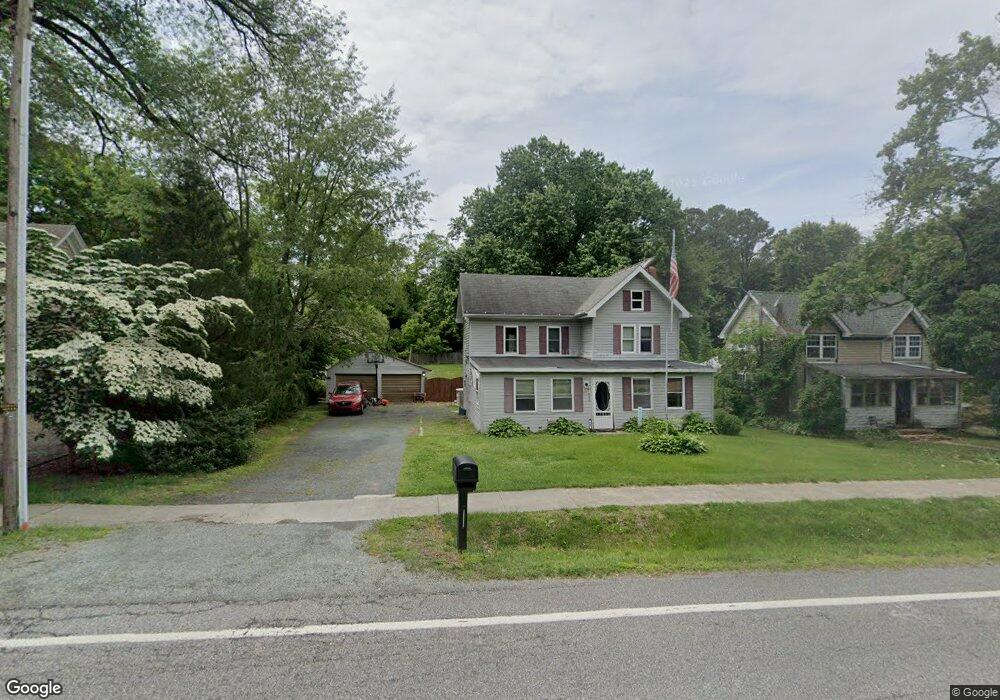
405 Main St Betterton, MD 21610
Estimated Value: $199,000 - $292,000
--
Bed
1
Bath
1,932
Sq Ft
$132/Sq Ft
Est. Value
About This Home
This home is located at 405 Main St, Betterton, MD 21610 and is currently estimated at $255,243, approximately $132 per square foot. 405 Main St is a home located in Kent County with nearby schools including Kent County Middle School and Kent County High School.
Ownership History
Date
Name
Owned For
Owner Type
Purchase Details
Closed on
Jan 20, 2017
Sold by
Nicholson John and Herman Jody
Bought by
Nicholson John
Current Estimated Value
Home Financials for this Owner
Home Financials are based on the most recent Mortgage that was taken out on this home.
Original Mortgage
$176,027
Outstanding Balance
$141,324
Interest Rate
3.25%
Mortgage Type
FHA
Estimated Equity
$113,919
Purchase Details
Closed on
Oct 18, 2006
Sold by
Herman James P and Herman Sheila L
Bought by
Nicholson John and Nicholson Jody
Home Financials for this Owner
Home Financials are based on the most recent Mortgage that was taken out on this home.
Original Mortgage
$90,000
Interest Rate
6.48%
Mortgage Type
Purchase Money Mortgage
Purchase Details
Closed on
Oct 16, 2006
Sold by
Herman James P and Herman Sheila L
Bought by
Nicholson John and Nicholson Jody
Home Financials for this Owner
Home Financials are based on the most recent Mortgage that was taken out on this home.
Original Mortgage
$90,000
Interest Rate
6.48%
Mortgage Type
Purchase Money Mortgage
Purchase Details
Closed on
Jul 19, 1999
Sold by
Sampogna Peter and Tracy Lee
Bought by
Herman James P and Herman Sheila L
Purchase Details
Closed on
Sep 20, 1985
Sold by
Kling Agnes E and Butler Anne M
Bought by
Sampogna Peter and Tracy Lee
Create a Home Valuation Report for This Property
The Home Valuation Report is an in-depth analysis detailing your home's value as well as a comparison with similar homes in the area
Home Values in the Area
Average Home Value in this Area
Purchase History
| Date | Buyer | Sale Price | Title Company |
|---|---|---|---|
| Nicholson John | -- | None Available | |
| Nicholson John | $115,000 | -- | |
| Nicholson John | $115,000 | -- | |
| Herman James P | $98,500 | -- | |
| Sampogna Peter | $47,500 | -- |
Source: Public Records
Mortgage History
| Date | Status | Borrower | Loan Amount |
|---|---|---|---|
| Open | Nicholson John | $176,027 | |
| Closed | Nicholson John | $90,000 | |
| Closed | Nicholson John | $90,000 |
Source: Public Records
Tax History Compared to Growth
Tax History
| Year | Tax Paid | Tax Assessment Tax Assessment Total Assessment is a certain percentage of the fair market value that is determined by local assessors to be the total taxable value of land and additions on the property. | Land | Improvement |
|---|---|---|---|---|
| 2025 | $3,055 | $211,500 | $98,200 | $113,300 |
| 2024 | $2,909 | $201,433 | $0 | $0 |
| 2023 | $2,769 | $191,367 | $0 | $0 |
| 2022 | $2,615 | $181,300 | $98,200 | $83,100 |
| 2021 | $2,633 | $181,300 | $98,200 | $83,100 |
| 2020 | $2,633 | $181,300 | $98,200 | $83,100 |
| 2019 | $2,718 | $187,200 | $107,200 | $80,000 |
| 2018 | $2,705 | $186,267 | $0 | $0 |
| 2017 | $2,695 | $185,333 | $0 | $0 |
| 2016 | -- | $184,400 | $0 | $0 |
| 2015 | $2,221 | $184,400 | $0 | $0 |
| 2014 | $2,221 | $184,400 | $0 | $0 |
Source: Public Records
Map
Nearby Homes
- 3 Howell Point Rd
- 200 Ericsson Ave
- 14 3rd Ave
- 0 1st Ave
- 21 6th Ave
- 1 Bayview Rd Unit 11A
- 1 Bayview Rd
- 1 Kent Dr
- 13699 Still Pond Rd
- 13931 Eagles Nest Farm Ln
- 0 Dutchtown Rd
- 0 Blackmon Ln
- 25619 W Hill Rd
- 26670 Maple Ave
- 0 Main St
- 12765 Still Pond Rd
- 12776 Still Pond Rd
- 0 Medders Rd
- 75 Vermont Ave
- 24 Ches Haven Rd