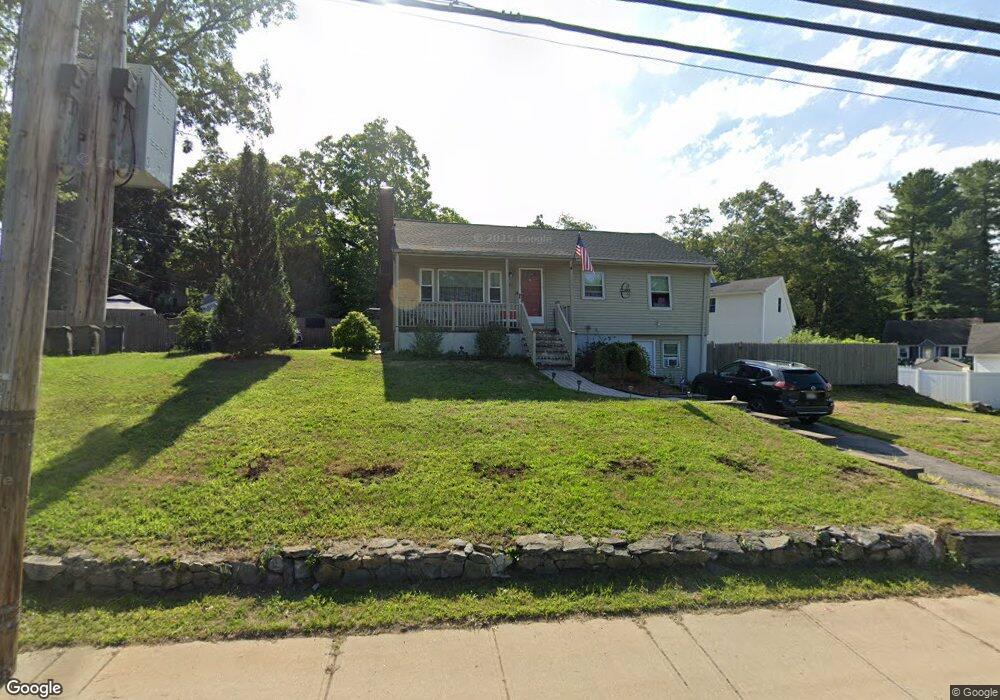
405 Middlesex Ave Wilmington, MA 01887
North Wilmington NeighborhoodEstimated Value: $582,161 - $684,000
2
Beds
2
Baths
1,040
Sq Ft
$602/Sq Ft
Est. Value
About This Home
This home is located at 405 Middlesex Ave, Wilmington, MA 01887 and is currently estimated at $626,540, approximately $602 per square foot. 405 Middlesex Ave is a home located in Middlesex County with nearby schools including Wilmington Middle School, Wilmington High School, and Abundant Life Christian School and Childcare.
Ownership History
Date
Name
Owned For
Owner Type
Purchase Details
Closed on
Jan 11, 2008
Sold by
Wallent Rose M
Bought by
Wallent Rt
Current Estimated Value
Purchase Details
Closed on
Apr 16, 1999
Sold by
Leclair David A and Leclair Rosemary K
Bought by
Wallent Rose M
Home Financials for this Owner
Home Financials are based on the most recent Mortgage that was taken out on this home.
Original Mortgage
$35,000
Interest Rate
7.04%
Mortgage Type
Purchase Money Mortgage
Purchase Details
Closed on
May 26, 1994
Sold by
Jaeschke Robert K and Jaeschke Kathleen
Bought by
Leclair David A and Leclair Rosemary K
Home Financials for this Owner
Home Financials are based on the most recent Mortgage that was taken out on this home.
Original Mortgage
$143,400
Interest Rate
8.22%
Mortgage Type
Purchase Money Mortgage
Create a Home Valuation Report for This Property
The Home Valuation Report is an in-depth analysis detailing your home's value as well as a comparison with similar homes in the area
Home Values in the Area
Average Home Value in this Area
Purchase History
| Date | Buyer | Sale Price | Title Company |
|---|---|---|---|
| Wallent Rt | -- | -- | |
| Wallent Rose M | $184,900 | -- | |
| Leclair David A | $151,000 | -- |
Source: Public Records
Mortgage History
| Date | Status | Borrower | Loan Amount |
|---|---|---|---|
| Previous Owner | Leclair David A | $35,000 | |
| Previous Owner | Leclair David A | $143,400 |
Source: Public Records
Tax History
| Year | Tax Paid | Tax Assessment Tax Assessment Total Assessment is a certain percentage of the fair market value that is determined by local assessors to be the total taxable value of land and additions on the property. | Land | Improvement |
|---|---|---|---|---|
| 2025 | $5,817 | $508,000 | $260,100 | $247,900 |
| 2024 | $5,588 | $488,900 | $260,100 | $228,800 |
| 2023 | $5,421 | $454,000 | $236,400 | $217,600 |
| 2022 | $5,153 | $395,500 | $197,000 | $198,500 |
| 2021 | $5,146 | $371,800 | $179,100 | $192,700 |
| 2020 | $4,881 | $359,400 | $179,100 | $180,300 |
| 2019 | $4,822 | $350,700 | $170,500 | $180,200 |
| 2018 | $4,494 | $311,900 | $162,400 | $149,500 |
| 2017 | $4,270 | $295,500 | $156,500 | $139,000 |
| 2016 | $4,092 | $279,700 | $149,100 | $130,600 |
| 2015 | $3,786 | $263,500 | $149,100 | $114,400 |
| 2014 | $3,590 | $252,100 | $142,000 | $110,100 |
Source: Public Records
Map
Nearby Homes
- 21 Marcia Rd
- 15 Mystic Ave
- 12 Hamlin Ln
- 17 Carson Ave
- 8 McDonald Rd
- 3 Clark Terrace
- 280 Martins Landing Unit 312
- 197 Wildwood St
- 220 Martins Landing Unit 411
- 220 Martins Landing Unit 410
- 220 Martins Landing Unit 309
- 260 Martins Landing Unit 508
- 260 Martins Landing Unit 102
- 200 Martins Landing Unit 102
- 300 Martins Landing Unit 505
- 56 Grove Ave
- 320 Martins Landing Unit 401
- 320 Martins Landing Unit 310
- 320 Martins Landing Unit 211
- 320 Martins Landing Unit 2410
Your Personal Tour Guide
Ask me questions while you tour the home.