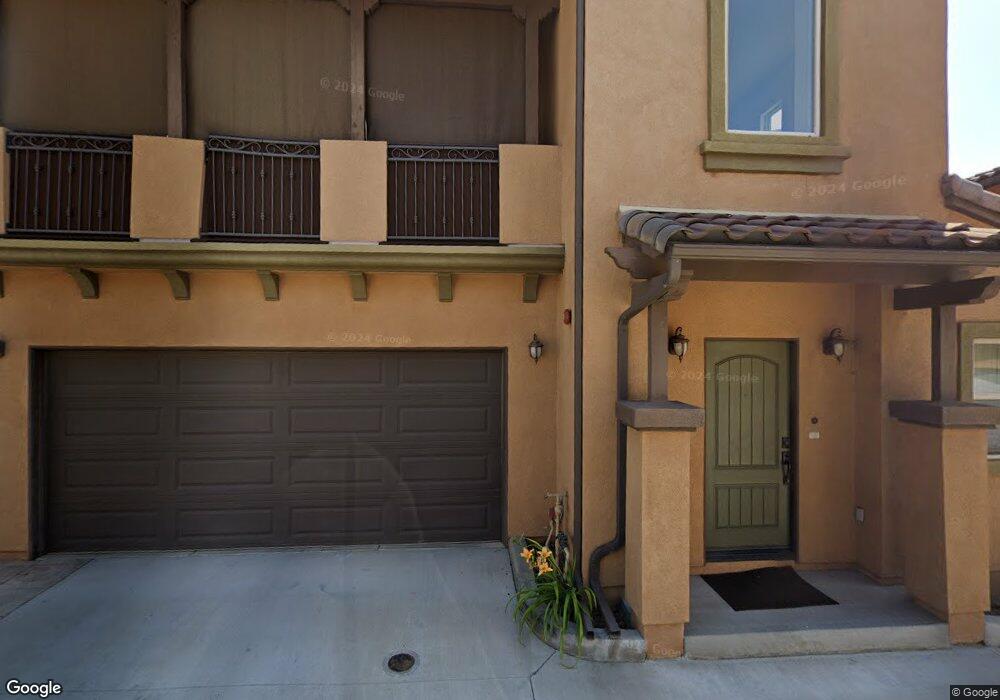
405 Monrovista Ave Unit A Monrovia, CA 91016
Estimated Value: $790,338 - $1,143,000
4
Beds
3
Baths
1,695
Sq Ft
$551/Sq Ft
Est. Value
About This Home
This home is located at 405 Monrovista Ave Unit A, Monrovia, CA 91016 and is currently estimated at $934,585, approximately $551 per square foot. 405 Monrovista Ave Unit A is a home located in Los Angeles County with nearby schools including Plymouth Elementary School, Santa Fe Computer Science Magnet, and Monrovia High School.
Ownership History
Date
Name
Owned For
Owner Type
Purchase Details
Closed on
Sep 25, 2012
Sold by
Do Michael Trung and Michael Truna Do Family Trust
Bought by
Do Michael Truna
Current Estimated Value
Home Financials for this Owner
Home Financials are based on the most recent Mortgage that was taken out on this home.
Original Mortgage
$365,000
Outstanding Balance
$251,969
Interest Rate
3.52%
Mortgage Type
New Conventional
Estimated Equity
$682,616
Purchase Details
Closed on
Sep 16, 2011
Sold by
Do Michael Trung
Bought by
Do Michael Trung and Michael Trung Do Family Trust
Purchase Details
Closed on
Oct 15, 2009
Sold by
Envision Community Development Company L
Bought by
Do Michael Trung
Home Financials for this Owner
Home Financials are based on the most recent Mortgage that was taken out on this home.
Original Mortgage
$340,000
Interest Rate
3.75%
Mortgage Type
New Conventional
Create a Home Valuation Report for This Property
The Home Valuation Report is an in-depth analysis detailing your home's value as well as a comparison with similar homes in the area
Home Values in the Area
Average Home Value in this Area
Purchase History
| Date | Buyer | Sale Price | Title Company |
|---|---|---|---|
| Do Michael Truna | -- | Lsi | |
| Do Michael Trung | -- | None Available | |
| Do Michael Trung | $440,000 | Lawyers Title |
Source: Public Records
Mortgage History
| Date | Status | Borrower | Loan Amount |
|---|---|---|---|
| Open | Do Michael Truna | $365,000 | |
| Previous Owner | Do Michael Trung | $340,000 |
Source: Public Records
Tax History Compared to Growth
Tax History
| Year | Tax Paid | Tax Assessment Tax Assessment Total Assessment is a certain percentage of the fair market value that is determined by local assessors to be the total taxable value of land and additions on the property. | Land | Improvement |
|---|---|---|---|---|
| 2025 | $7,836 | $567,949 | $210,785 | $357,164 |
| 2024 | $7,653 | $556,813 | $206,652 | $350,161 |
| 2023 | $7,477 | $545,896 | $202,600 | $343,296 |
| 2022 | $7,260 | $535,193 | $198,628 | $336,565 |
| 2021 | $7,115 | $524,700 | $194,734 | $329,966 |
| 2020 | $6,897 | $519,321 | $192,738 | $326,583 |
| 2019 | $6,776 | $509,139 | $188,959 | $320,180 |
| 2018 | $6,630 | $499,156 | $185,254 | $313,902 |
| 2016 | $6,371 | $479,775 | $178,061 | $301,714 |
| 2015 | $6,232 | $472,569 | $175,387 | $297,182 |
| 2014 | $6,168 | $463,313 | $171,952 | $291,361 |
Source: Public Records
Map
Nearby Homes
- 2112 California Ave
- 1408 S California Ave Unit C
- 1406 S California Ave Unit C
- 322 Joella St
- 2048 Felberg Ave
- 1900 Mountain Ave
- 811 Cinnamon Ln
- 826 Cinnamon Ln
- 151 E El Norte St
- 2024 Mountain Ave
- 237 Los Angeles Ave
- 139 Spanner St
- 874 Cinnamon Ln Unit 62
- 207 Los Angeles Ave
- 114 1/2 Los Angeles Ave
- 117 Spanner St
- 134 E Cypress Ave
- 237 W Central Ave
- 333 W Duarte Rd Unit A
- 1245 Oliva Ct
- 405 Monrovista Ave
- 405 Monrovista Ave Unit B
- 405 Monrovista Ave Unit E
- 405 Monrovista Ave Unit C
- 405 Monrovista Ave Unit F
- 405 Monrovista Ave Unit D
- 417 Monrovista Ave Unit A
- 417 Monrovista Ave Unit B
- 429 Monrovista Ave
- 409 Monrovista Ave Unit B
- 409 Monrovista Ave Unit A
- 409 Monrovista Ave Unit D
- 409 Monrovista Ave Unit C
- 401 Monrovista Ave Unit C
- 401 Monrovista Ave Unit A
- 401 Monrovista Ave Unit B
- 401 Monrovista Ave Unit C
- 401 Monrovista Ave Unit D
- 401 Monrovista Ave Unit E
- 401 Monrovista Ave Unit F