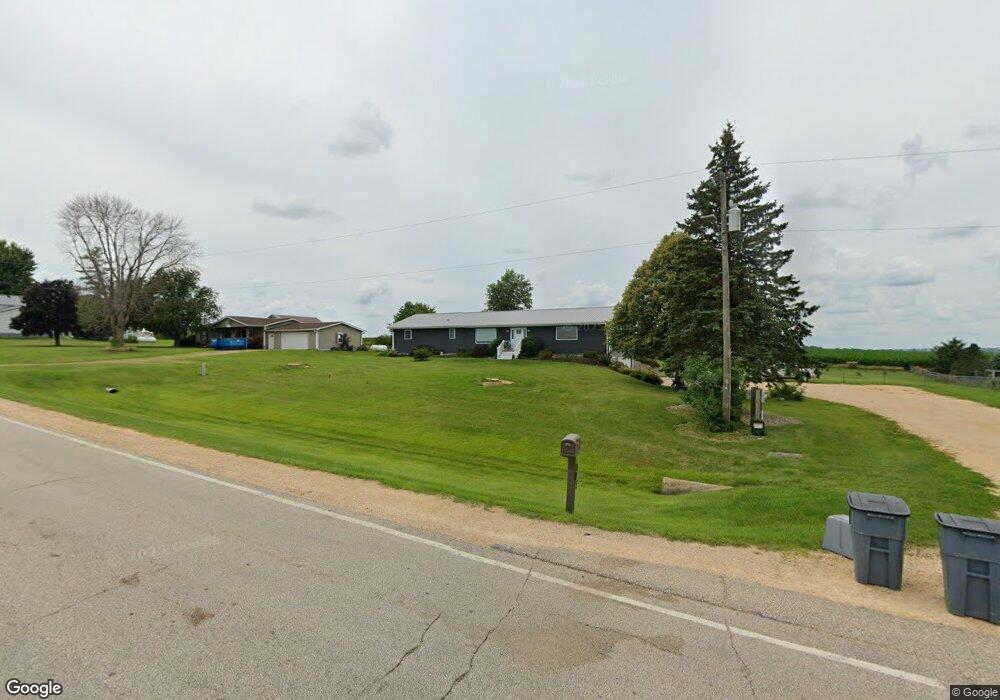
405 N Main St Onslow, IA 52321
Estimated Value: $193,000 - $258,300
3
Beds
2
Baths
2,400
Sq Ft
$99/Sq Ft
Est. Value
About This Home
This home is located at 405 N Main St, Onslow, IA 52321 and is currently estimated at $237,325, approximately $98 per square foot. 405 N Main St is a home located in Jones County with nearby schools including Midland Elementary School and Midland Middle/High School.
Ownership History
Date
Name
Owned For
Owner Type
Purchase Details
Closed on
Sep 15, 2014
Sold by
Dundee Harry L and Dundee Victoria L
Bought by
Gilson Nicholas C and Gilson Cassandra R
Current Estimated Value
Home Financials for this Owner
Home Financials are based on the most recent Mortgage that was taken out on this home.
Original Mortgage
$28,000
Interest Rate
4.11%
Mortgage Type
Stand Alone Second
Purchase Details
Closed on
Dec 30, 2011
Sold by
Somerville Lou A and Somerville Mary E
Bought by
Dundee Harry L and Dundee Victoria L
Home Financials for this Owner
Home Financials are based on the most recent Mortgage that was taken out on this home.
Original Mortgage
$132,653
Interest Rate
3.98%
Mortgage Type
New Conventional
Create a Home Valuation Report for This Property
The Home Valuation Report is an in-depth analysis detailing your home's value as well as a comparison with similar homes in the area
Purchase History
| Date | Buyer | Sale Price | Title Company |
|---|---|---|---|
| Gilson Nicholas C | $140,000 | None Available | |
| Dundee Harry L | $130,000 | Security First Title Co |
Source: Public Records
Mortgage History
| Date | Status | Borrower | Loan Amount |
|---|---|---|---|
| Closed | Gilson Nicholas C | $28,000 | |
| Open | Gilson Nicholas C | $112,000 | |
| Previous Owner | Dundee Harry L | $132,653 |
Source: Public Records
Tax History
| Year | Tax Paid | Tax Assessment Tax Assessment Total Assessment is a certain percentage of the fair market value that is determined by local assessors to be the total taxable value of land and additions on the property. | Land | Improvement |
|---|---|---|---|---|
| 2025 | $3,130 | $208,370 | $15,450 | $192,920 |
| 2024 | $3,130 | $174,490 | $15,450 | $159,040 |
| 2023 | $2,666 | $174,490 | $15,450 | $159,040 |
| 2022 | $2,386 | $151,530 | $15,450 | $136,080 |
| 2021 | $2,386 | $151,530 | $15,450 | $136,080 |
| 2020 | $2,432 | $141,310 | $15,450 | $125,860 |
| 2019 | $1,974 | $141,310 | $15,450 | $125,860 |
| 2018 | $1,936 | $110,180 | $13,700 | $96,480 |
| 2017 | $1,936 | $110,180 | $13,700 | $96,480 |
| 2016 | $1,900 | $110,180 | $13,700 | $96,480 |
| 2015 | $1,900 | $110,180 | $13,700 | $96,480 |
| 2014 | $2,194 | $110,180 | $0 | $0 |
| 2013 | $1,856 | $110,180 | $13,700 | $96,480 |
Source: Public Records
Map
Nearby Homes
- 305 N Main St
- 8212 98th St
- 105 E Main St
- 305 W Main St
- 108 S Maple St
- 12585 Saint Paul St
- 8897 20th Ave
- 13619 170th St
- 0 Co Home Rd & Amber Rd Unit 2509866
- 406 Broadway St
- 00 110th Ave
- 0 E23 Co Home Rd at 170th Ave Unit NOC6334397
- 0 Ave Unit 2509865
- 109 W Cleveland St
- 404 Highland St
- 302 Walnut St
- 907 Southhaven Dr
- 0 Us-151 & Co Home Rd
- 115 E Dunham St
- 108 Wood Ridge Rd
Your Personal Tour Guide
Ask me questions while you tour the home.