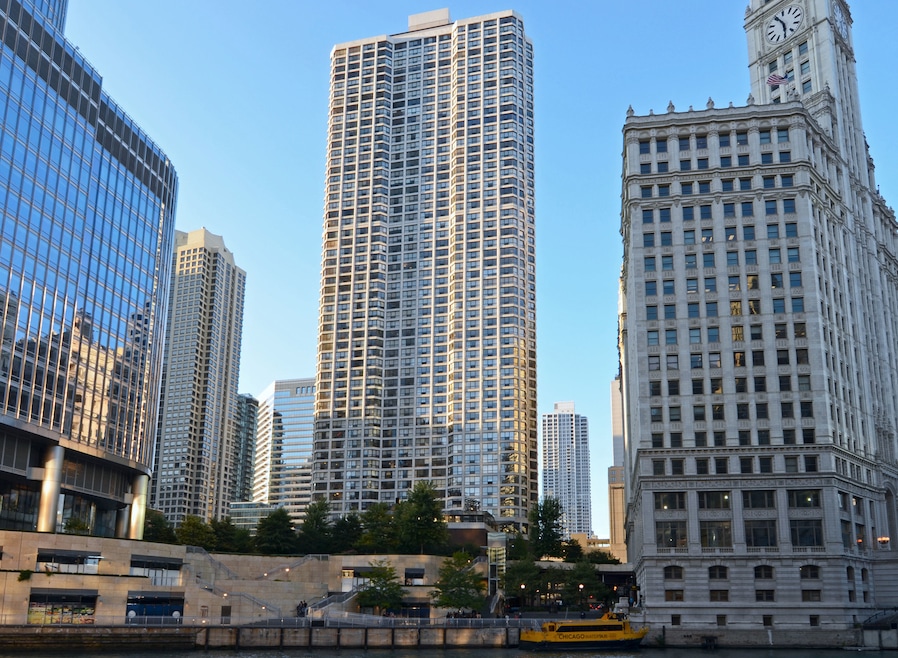
405 N Wabash Ave Unit C7 Chicago, IL 60611
River North NeighborhoodEstimated payment $235/month
Total Views
10,277
0
Acre
--
Price per Acre
0
Sq Ft Lot
About This Lot
PARKING SPACE IN RIVER PLAZA CONDOMINIUM GARAGE LOCATED ON "C" LEVEL (G3). IT'S HEATED, SECURITY WITH KEY CARD ENTRY. GARAGE MANAGER ON DUTY. Garage was COMPLETELY renovated ($6million update) (entire remodel). Limited number of parking 364 spaces shared with 405 Wabash Ave (697 units) & 403 N Wabash Ave (53 Units). 403 N Wabash Ave building does not sell deeded parking, only COMMON ASSIGNED RIGHTS FOR HIGHER PRICES.
Property Details
Property Type
- Land
Est. Annual Taxes
- $604
Year Built
- Built in 1977
Lot Details
- Lot Dimensions are 11x16
Home Design
- Entry on the 3rd floor
Parking
- 1 Parking Space
- Deeded Parking
Community Details
Map
Create a Home Valuation Report for This Property
The Home Valuation Report is an in-depth analysis detailing your home's value as well as a comparison with similar homes in the area
Home Values in the Area
Average Home Value in this Area
Tax History
| Year | Tax Paid | Tax Assessment Tax Assessment Total Assessment is a certain percentage of the fair market value that is determined by local assessors to be the total taxable value of land and additions on the property. | Land | Improvement |
|---|---|---|---|---|
| 2024 | $619 | $3,469 | $2,228 | $1,241 |
| 2023 | $604 | $2,937 | $500 | $2,437 |
| 2022 | $604 | $2,937 | $500 | $2,437 |
| 2021 | $590 | $2,935 | $499 | $2,436 |
| 2020 | $571 | $2,565 | $1,385 | $1,180 |
| 2019 | $560 | $2,785 | $1,385 | $1,400 |
| 2018 | $550 | $2,785 | $1,385 | $1,400 |
| 2017 | $540 | $2,506 | $1,180 | $1,326 |
| 2016 | $502 | $2,506 | $1,180 | $1,326 |
| 2015 | $459 | $2,506 | $1,180 | $1,326 |
| 2014 | $372 | $2,005 | $923 | $1,082 |
| 2013 | $365 | $2,005 | $923 | $1,082 |
Source: Public Records
Property History
| Date | Event | Price | List to Sale | Price per Sq Ft |
|---|---|---|---|---|
| 11/01/2023 11/01/23 | For Sale | $35,000 | -- | -- |
Source: Midwest Real Estate Data (MRED)
Purchase History
| Date | Type | Sale Price | Title Company |
|---|---|---|---|
| Interfamily Deed Transfer | -- | None Available | |
| Warranty Deed | $34,000 | Multiple | |
| Warranty Deed | $34,000 | Multiple |
Source: Public Records
Mortgage History
| Date | Status | Loan Amount | Loan Type |
|---|---|---|---|
| Open | $23,800 | Unknown | |
| Closed | $23,800 | Unknown |
Source: Public Records
Source: Midwest Real Estate Data (MRED)
MLS Number: 11920548
APN: 17-10-132-040-1164
Nearby Homes
- 405 N Wabash Ave Unit 4308
- 405 N Wabash Ave Unit D97-98
- 405 N Wabash Ave Unit 314
- 405 N Wabash Ave Unit B117
- 405 N Wabash Ave Unit C102103
- 405 N Wabash Ave Unit 2203
- 405 N Wabash Ave Unit A37
- 405 N Wabash Ave Unit 2313
- 405 N Wabash Ave Unit D77-78
- 405 N Wabash Ave Unit 2314
- 405 N Wabash Ave Unit C62
- 405 N Wabash Ave Unit C21-22
- 405 N Wabash Ave Unit 1410
- 405 N Wabash Ave Unit D115
- 405 N Wabash Ave Unit B13
- 405 N Wabash Ave Unit B4
- 405 N Wabash Ave Unit 2801
- 405 N Wabash Ave Unit 1608
- 405 N Wabash Ave Unit B58
- 405 N Wabash Ave Unit B93
- 405 N Wabash Ave Unit 2603
- 405 N Wabash Ave Unit 5009
- 405 N Wabash Ave Unit 5112
- 405 N Wabash Ave Unit 2008
- 405 N Wabash Ave
- 71 W Hubbard St Unit ID1225926P
- 401 N Wabash Ave Unit 74g
- 401 N Wabash Ave Unit 29C
- 440 N Wabash Ave Unit 1504
- 440 N Wabash Ave Unit 2501
- 440 N Wabash Ave Unit 1707
- 440 N Wabash Ave
- 440 N Wabash Ave Unit 511
- 440 N Wabash Ave Unit 1011
- 403 N Wabash Ave Unit 14A
- 401 N Wabash Ave Unit 30E
- 401 N Wabash Ave Unit 75A
- 401 N Wabash Ave Unit 72F
- 401 N Wabash Ave Unit 59B
- 401 N Wabash Ave Unit 31F

