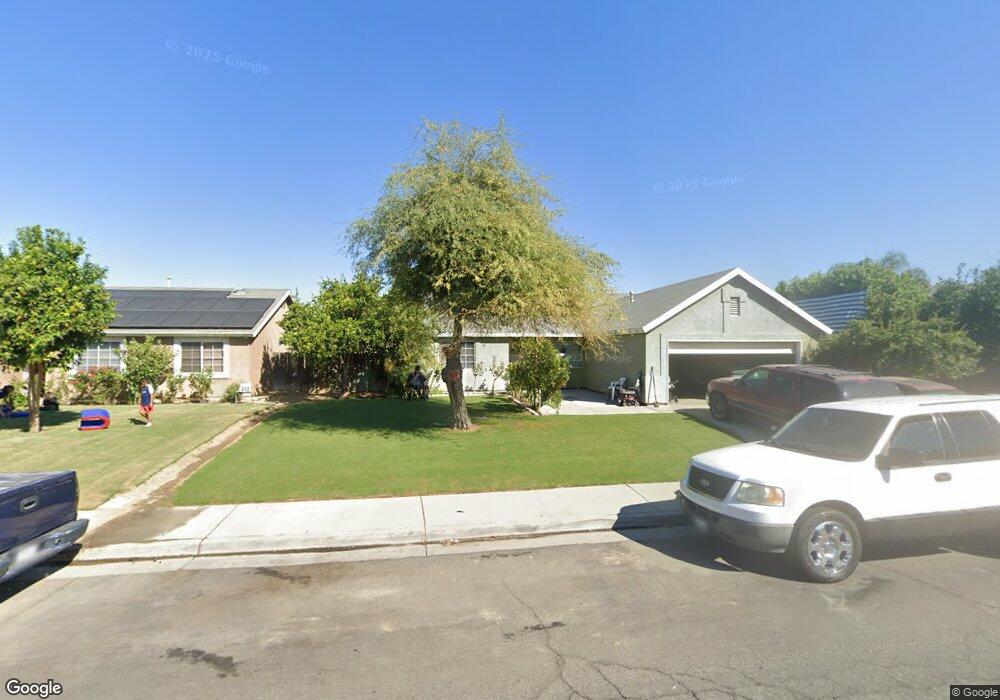
405 North El Dorado Cir Delano, CA 93215
West Delano NeighborhoodEstimated Value: $300,000 - $336,000
3
Beds
2
Baths
1,312
Sq Ft
$242/Sq Ft
Est. Value
About This Home
This home is located at 405 North El Dorado Cir, Delano, CA 93215 and is currently estimated at $317,640, approximately $242 per square foot. 405 North El Dorado Cir is a home located in Kern County with nearby schools including Fremont Elementary School, Almond Tree Middle School, and Robert F. Kennedy High School.
Ownership History
Date
Name
Owned For
Owner Type
Purchase Details
Closed on
Feb 25, 2008
Sold by
Vieyra Salvador Perez
Bought by
Vieyra Sara
Current Estimated Value
Home Financials for this Owner
Home Financials are based on the most recent Mortgage that was taken out on this home.
Original Mortgage
$90,335
Interest Rate
5.64%
Mortgage Type
FHA
Purchase Details
Closed on
Jan 2, 2008
Sold by
Camarillo Isidro
Bought by
Vieyra Alberto and Vieyra Sara
Home Financials for this Owner
Home Financials are based on the most recent Mortgage that was taken out on this home.
Original Mortgage
$90,335
Interest Rate
5.64%
Mortgage Type
FHA
Purchase Details
Closed on
Nov 15, 1996
Sold by
Syroli
Bought by
Vieyra Alberto and Camarillo Isidro
Home Financials for this Owner
Home Financials are based on the most recent Mortgage that was taken out on this home.
Original Mortgage
$85,941
Interest Rate
7.59%
Mortgage Type
FHA
Create a Home Valuation Report for This Property
The Home Valuation Report is an in-depth analysis detailing your home's value as well as a comparison with similar homes in the area
Home Values in the Area
Average Home Value in this Area
Purchase History
| Date | Buyer | Sale Price | Title Company |
|---|---|---|---|
| Vieyra Sara | -- | None Available | |
| Vieyra Alberto | -- | None Available | |
| Vieyra Alberto | $45,500 | None Available | |
| Vieyra Alberto | $86,500 | First American Title Ins Co |
Source: Public Records
Mortgage History
| Date | Status | Borrower | Loan Amount |
|---|---|---|---|
| Previous Owner | Vieyra Alberto | $90,335 | |
| Previous Owner | Vieyra Alberto | $85,941 |
Source: Public Records
Tax History Compared to Growth
Tax History
| Year | Tax Paid | Tax Assessment Tax Assessment Total Assessment is a certain percentage of the fair market value that is determined by local assessors to be the total taxable value of land and additions on the property. | Land | Improvement |
|---|---|---|---|---|
| 2025 | $2,146 | $182,673 | $49,113 | $133,560 |
| 2024 | $2,085 | $179,092 | $48,151 | $130,941 |
| 2023 | $2,085 | $175,581 | $47,207 | $128,374 |
| 2022 | $2,051 | $172,139 | $46,282 | $125,857 |
| 2021 | $1,976 | $168,765 | $45,375 | $123,390 |
| 2020 | $1,976 | $167,035 | $44,910 | $122,125 |
| 2019 | $1,941 | $167,035 | $44,910 | $122,125 |
| 2018 | $1,914 | $160,551 | $43,167 | $117,384 |
| 2017 | $1,925 | $157,404 | $42,321 | $115,083 |
| 2016 | $1,893 | $154,319 | $41,492 | $112,827 |
| 2015 | $1,955 | $152,002 | $40,869 | $111,133 |
| 2014 | $1,765 | $144,000 | $36,000 | $108,000 |
Source: Public Records
Map
Nearby Homes
- 230 W 15th Place
- 419 Catalina Place
- 229 15th Place
- 1509 Borel St
- 725 Anita Ave Unit 5
- 146 W 11th Place
- 142 W 11th Place
- 0 Timmons Ave
- 1942 Clinton St
- 816 Rosa Ct
- Floorplan 1320 at Ranho Del Sol - Rancho Del Sol
- Floorplan 1700 at Ranho Del Sol - Rancho Del Sol
- Floorplan 1523 at Ranho Del Sol - Rancho Del Sol
- Floorplan 2100 at Ranho Del Sol - Rancho Del Sol
- Floorplan 1810 at Ranho Del Sol - Rancho Del Sol
- 814 Encanto Way
- 718 Florito Way
- 115 9th Ave
- 441 14th Ave
- 1417 Ellington St
- 409 North El Dorado Cir
- 1469 Almond Tree Way
- 482 South Cabrillo Way
- 1477 Almond Tree Way
- 478 South Cabrillo Way
- 415 North El Dorado Cir
- 1485 Almond Tree Way
- 474 South Cabrillo Way
- 408 North El Dorado Cir
- 402 North El Dorado Cir
- 412 N El Dorado Cir
- 412 North El Dorado Cir
- 419 North El Dorado Cir
- 418 North El Dorado Cir
- 470 South Cabrillo Way
- 470 S Cabrillo Way
- 1445 Almond Tree Way
- 422 North El Dorado Cir
- 423 North El Dorado Cir
- 483 South El Dorado Cir