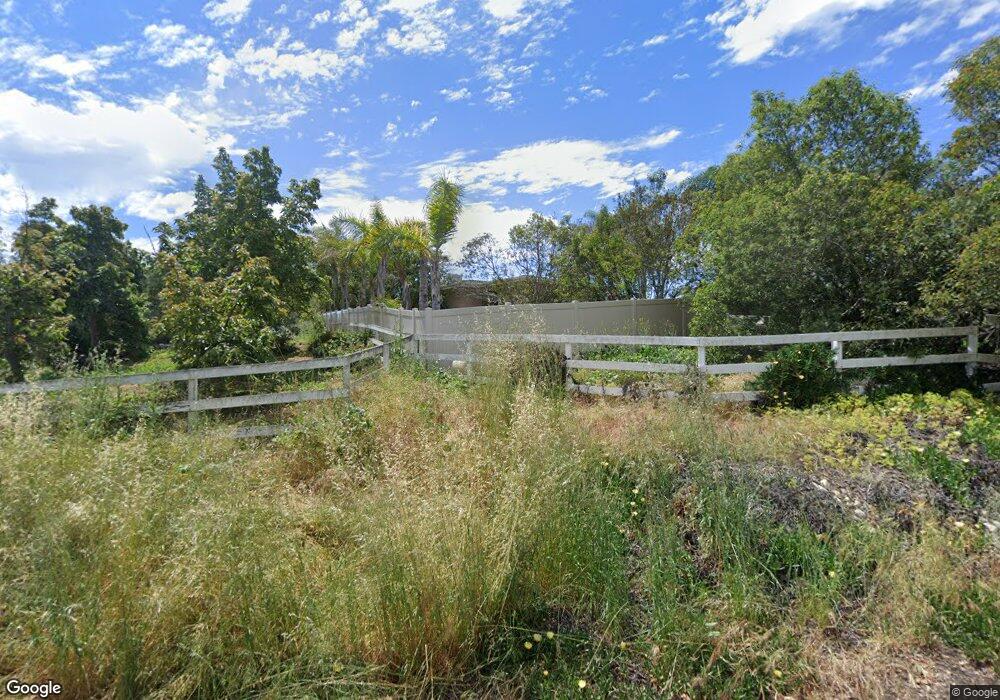
405 Olive Hill Way Fallbrook, CA 92028
Estimated Value: $994,000 - $1,158,752
3
Beds
3
Baths
2,940
Sq Ft
$373/Sq Ft
Est. Value
About This Home
This home is located at 405 Olive Hill Way, Fallbrook, CA 92028 and is currently estimated at $1,095,938, approximately $372 per square foot. 405 Olive Hill Way is a home located in San Diego County with nearby schools including Fallbrook STEM Academy, James E. Potter Intermediate School, and Fallbrook High School.
Ownership History
Date
Name
Owned For
Owner Type
Purchase Details
Closed on
Feb 29, 2016
Sold by
Hancu Janet R
Bought by
Hancu Janet R
Current Estimated Value
Purchase Details
Closed on
Jan 19, 2011
Sold by
Us Bank National Association
Bought by
Hancu Michael and Hancu Janet R
Home Financials for this Owner
Home Financials are based on the most recent Mortgage that was taken out on this home.
Original Mortgage
$276,000
Outstanding Balance
$187,808
Interest Rate
4.74%
Mortgage Type
New Conventional
Estimated Equity
$908,130
Purchase Details
Closed on
Oct 4, 2010
Sold by
Marshall Randy Allen
Bought by
U S Bank National Association
Purchase Details
Closed on
Mar 9, 1998
Sold by
Coppens Family Trust 02-14-87
Bought by
Marshall Randy Allen
Home Financials for this Owner
Home Financials are based on the most recent Mortgage that was taken out on this home.
Original Mortgage
$200,000
Interest Rate
7%
Purchase Details
Closed on
Oct 23, 1991
Create a Home Valuation Report for This Property
The Home Valuation Report is an in-depth analysis detailing your home's value as well as a comparison with similar homes in the area
Home Values in the Area
Average Home Value in this Area
Purchase History
| Date | Buyer | Sale Price | Title Company |
|---|---|---|---|
| Hancu Janet R | -- | None Available | |
| Hancu Michael | $345,000 | First American Title Company | |
| U S Bank National Association | $399,900 | Accommodation | |
| Marshall Randy Allen | $360,000 | Stewart Title | |
| -- | $250,000 | -- |
Source: Public Records
Mortgage History
| Date | Status | Borrower | Loan Amount |
|---|---|---|---|
| Open | Hancu Michael | $276,000 | |
| Previous Owner | Marshall Randy Allen | $200,000 | |
| Closed | Marshall Randy Allen | $110,000 |
Source: Public Records
Tax History
| Year | Tax Paid | Tax Assessment Tax Assessment Total Assessment is a certain percentage of the fair market value that is determined by local assessors to be the total taxable value of land and additions on the property. | Land | Improvement |
|---|---|---|---|---|
| 2025 | $4,703 | $441,993 | $187,511 | $254,482 |
| 2024 | $4,703 | $433,328 | $183,835 | $249,493 |
| 2023 | $4,576 | $424,832 | $180,231 | $244,601 |
| 2022 | $4,578 | $416,503 | $176,698 | $239,805 |
| 2021 | $4,436 | $408,337 | $173,234 | $235,103 |
| 2020 | $4,477 | $404,151 | $171,458 | $232,693 |
| 2019 | $4,395 | $396,228 | $168,097 | $228,131 |
| 2018 | $4,330 | $388,459 | $164,801 | $223,658 |
| 2017 | $4,246 | $380,843 | $161,570 | $219,273 |
| 2016 | $4,142 | $373,376 | $158,402 | $214,974 |
| 2015 | $4,064 | $367,768 | $156,023 | $211,745 |
| 2014 | $3,982 | $360,565 | $152,967 | $207,598 |
Source: Public Records
Map
Nearby Homes
- Vacant lot 65 Olive Hill Rd
- 2449 Trails End
- 2240 Aqua Hill Rd
- 2824 Olive Hill Rd
- 588 Twin Country Ln
- 1195 Via Encinos Dr
- 157 Spanish Spur
- 0 Winter Haven Rd Unit 41
- 370 Spanish Spur
- 2445 S Stage Coach Ln
- 1335 El Nido Dr
- 2327 Clearcrest Ln
- 2194 Stone Castle
- 1630 S Mission Rd
- 1474 Via Encinos Dr
- 1650 Winterwarm Dr
- 789 Glenhart Place
- 2116 Kirkcaldy Rd
- 3121 Alta Verde Dr
- 2144 Knollwood Ave
- 457 Olive Hill Way
- 0 Olive Hill Way Unit T11089725
- 0 Olive Hill Way Unit 110039445
- 3325 Olive Hill Rd
- 464 Olive Hill Way
- 442 Olive Hill Way
- 0000 Olive Hill Way
- 401 Olive Hill Way
- 408 Olive Hill Way
- 3335 Olive Hill Rd
- 0 Olive Hill Road Adj To 3335 Olive Hill Rd Unit NDP2210830
- 480 Olive Hill Way
- 3000 Olive Hill Rd
- 3363 Olive Hill Rd
- 3203 Olive Hill Rd
- 3157 Olive Hill Rd
- 3155 Olive Hill Rd
- Vacant lot Olive Hill Rd
- 3351 Olive Hill Rd
- 3270 Olive Hill Rd
Your Personal Tour Guide
Ask me questions while you tour the home.