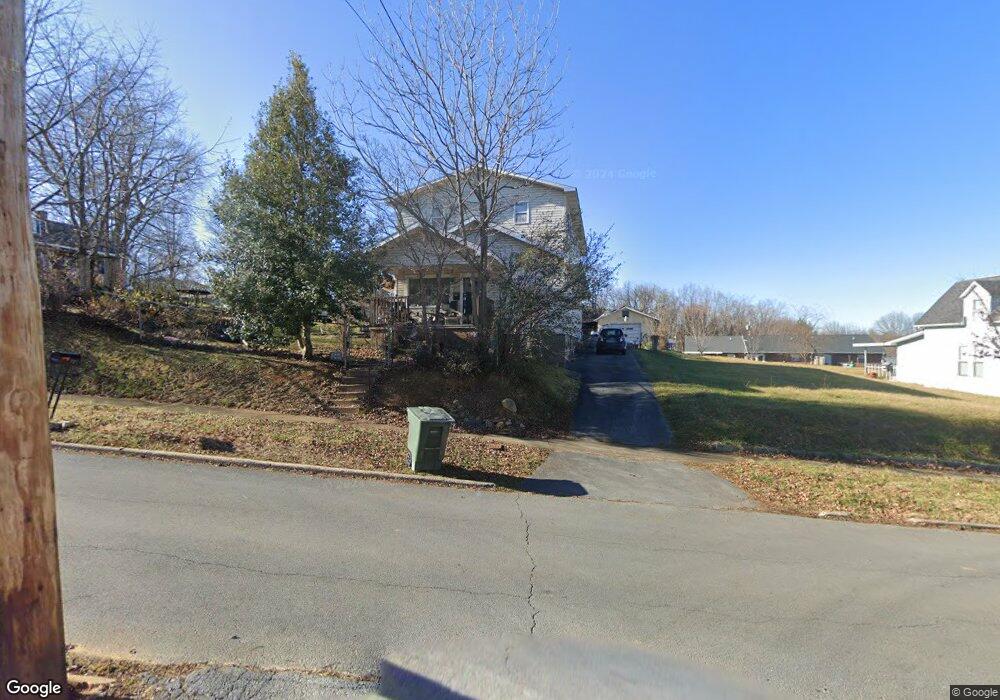
405 S 2nd St Elizabethton, TN 37643
Estimated Value: $198,000 - $288,000
3
Beds
2
Baths
1,056
Sq Ft
$227/Sq Ft
Est. Value
About This Home
This home is located at 405 S 2nd St, Elizabethton, TN 37643 and is currently estimated at $239,706, approximately $226 per square foot. 405 S 2nd St is a home with nearby schools including Elizabethton High School.
Ownership History
Date
Name
Owned For
Owner Type
Purchase Details
Closed on
Mar 1, 2002
Sold by
Quindry John
Bought by
Oliver Jerry
Current Estimated Value
Home Financials for this Owner
Home Financials are based on the most recent Mortgage that was taken out on this home.
Original Mortgage
$42,000
Interest Rate
6.98%
Purchase Details
Closed on
Feb 11, 1992
Bought by
Jenkins Crumley
Purchase Details
Closed on
Feb 10, 1992
Purchase Details
Closed on
Jan 10, 1989
Bought by
Carr George and Carr Beulah J
Purchase Details
Closed on
Feb 25, 1971
Bought by
Ellis Jean
Create a Home Valuation Report for This Property
The Home Valuation Report is an in-depth analysis detailing your home's value as well as a comparison with similar homes in the area
Home Values in the Area
Average Home Value in this Area
Purchase History
| Date | Buyer | Sale Price | Title Company |
|---|---|---|---|
| Oliver Jerry | $52,500 | -- | |
| Jenkins Crumley | $39,900 | -- | |
| -- | -- | -- | |
| Carr George | $24,000 | -- | |
| Ellis Jean | -- | -- |
Source: Public Records
Mortgage History
| Date | Status | Borrower | Loan Amount |
|---|---|---|---|
| Closed | Ellis Jean | $42,000 |
Source: Public Records
Tax History Compared to Growth
Tax History
| Year | Tax Paid | Tax Assessment Tax Assessment Total Assessment is a certain percentage of the fair market value that is determined by local assessors to be the total taxable value of land and additions on the property. | Land | Improvement |
|---|---|---|---|---|
| 2024 | $1,108 | $33,600 | $10,150 | $23,450 |
| 2023 | $1,108 | $33,600 | $0 | $0 |
| 2022 | $1,210 | $33,600 | $10,150 | $23,450 |
| 2021 | $682 | $33,600 | $10,150 | $23,450 |
| 2020 | $1,042 | $33,600 | $10,150 | $23,450 |
| 2019 | $1,042 | $24,125 | $4,500 | $19,625 |
| 2018 | $1,028 | $24,125 | $4,500 | $19,625 |
| 2017 | $1,032 | $24,125 | $4,500 | $19,625 |
| 2016 | $1,028 | $24,225 | $4,500 | $19,725 |
| 2015 | $1,030 | $24,225 | $4,500 | $19,725 |
| 2014 | $1,014 | $23,750 | $4,500 | $19,250 |
Source: Public Records
Map
Nearby Homes