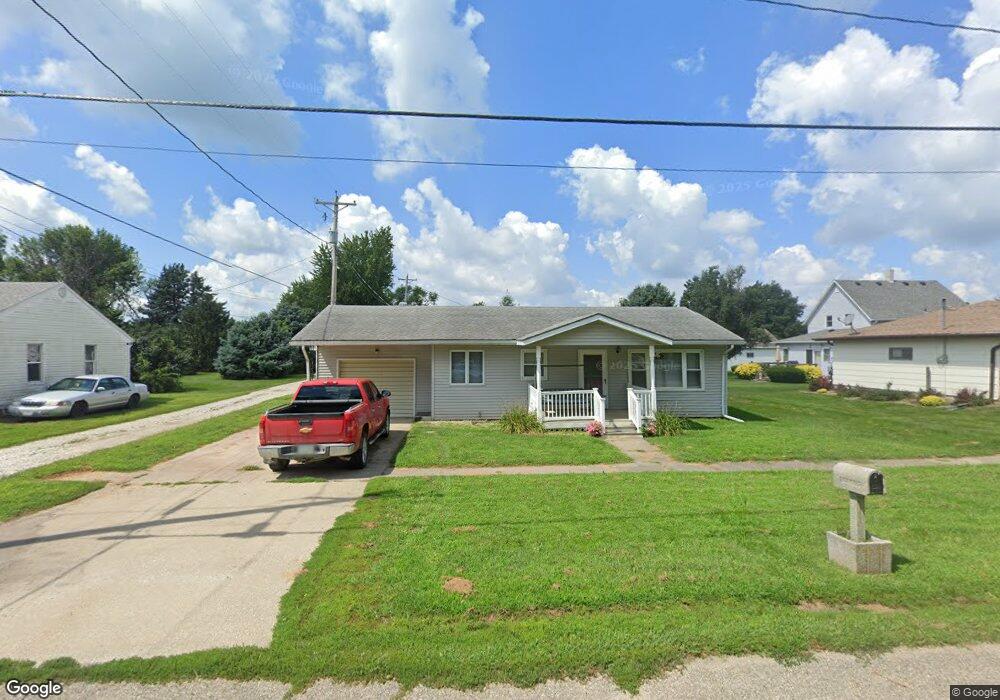
405 S 7th St Dunlap, IA 51529
Estimated Value: $74,000 - $97,004
2
Beds
1
Bath
884
Sq Ft
$98/Sq Ft
Est. Value
About This Home
This home is located at 405 S 7th St, Dunlap, IA 51529 and is currently estimated at $86,751, approximately $98 per square foot. 405 S 7th St is a home located in Harrison County with nearby schools including Boyer Valley Elementary School and Boyer Valley Middle/High School.
Ownership History
Date
Name
Owned For
Owner Type
Purchase Details
Closed on
Jul 29, 2022
Sold by
Fineran Marilyn D
Bought by
Brown Ian G
Current Estimated Value
Home Financials for this Owner
Home Financials are based on the most recent Mortgage that was taken out on this home.
Original Mortgage
$78,375
Interest Rate
5.13%
Mortgage Type
New Conventional
Purchase Details
Closed on
Apr 11, 2011
Sold by
Estate Of Howard C Andrews Estate
Bought by
Andrews Vernon and Finneran Marilyn
Create a Home Valuation Report for This Property
The Home Valuation Report is an in-depth analysis detailing your home's value as well as a comparison with similar homes in the area
Home Values in the Area
Average Home Value in this Area
Purchase History
| Date | Buyer | Sale Price | Title Company |
|---|---|---|---|
| Brown Ian G | $82,500 | -- | |
| Andrews Vernon | -- | None Available |
Source: Public Records
Mortgage History
| Date | Status | Borrower | Loan Amount |
|---|---|---|---|
| Previous Owner | Brown Ian G | $78,375 |
Source: Public Records
Tax History Compared to Growth
Tax History
| Year | Tax Paid | Tax Assessment Tax Assessment Total Assessment is a certain percentage of the fair market value that is determined by local assessors to be the total taxable value of land and additions on the property. | Land | Improvement |
|---|---|---|---|---|
| 2025 | $1,434 | $87,330 | $7,050 | $80,280 |
| 2024 | $1,434 | $79,630 | $7,050 | $72,580 |
| 2023 | $1,378 | $79,630 | $7,050 | $72,580 |
| 2022 | $1,258 | $69,175 | $7,053 | $62,122 |
| 2021 | $1,258 | $69,175 | $7,053 | $62,122 |
| 2020 | $1,198 | $59,275 | $7,053 | $52,222 |
| 2019 | $1,162 | $59,275 | $7,053 | $52,222 |
| 2018 | $1,154 | $53,932 | $0 | $0 |
| 2017 | $1,186 | $53,932 | $0 | $0 |
| 2016 | $1,172 | $53,932 | $0 | $0 |
| 2015 | $1,172 | $48,588 | $0 | $0 |
| 2014 | $1,102 | $48,588 | $0 | $0 |
Source: Public Records
Map
Nearby Homes