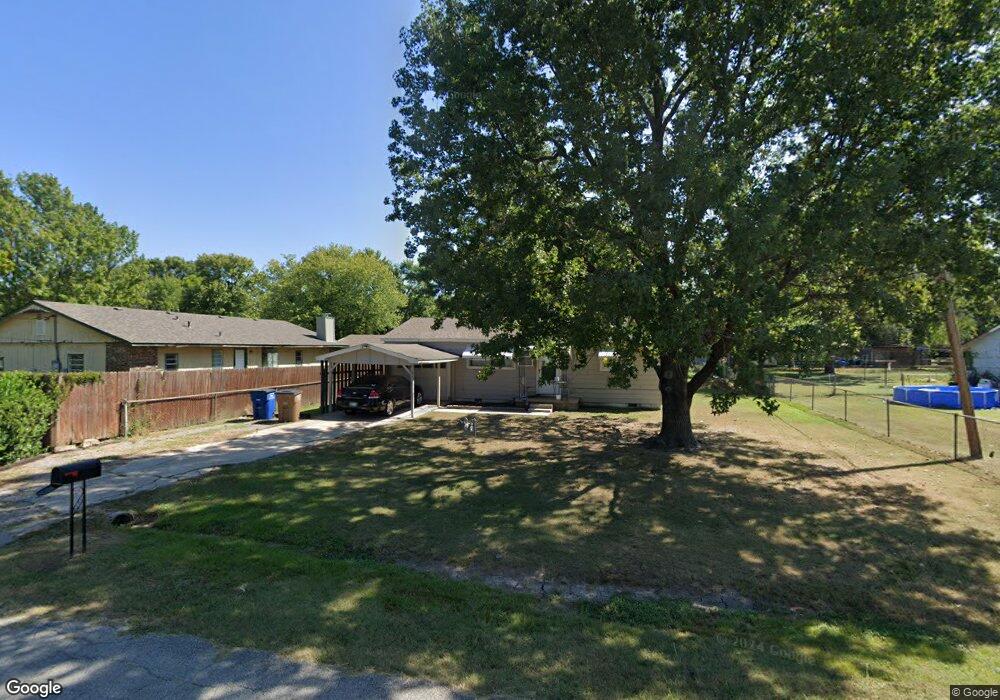
405 S Johnson Ave Wagoner, OK 74467
Estimated Value: $98,000 - $191,259
2
Beds
1
Bath
864
Sq Ft
$160/Sq Ft
Est. Value
About This Home
This home is located at 405 S Johnson Ave, Wagoner, OK 74467 and is currently estimated at $138,315, approximately $160 per square foot. 405 S Johnson Ave is a home located in Wagoner County with nearby schools including Ellington Elementary School, William R. Teague Elementary School, and Wagoner Middle School.
Ownership History
Date
Name
Owned For
Owner Type
Purchase Details
Closed on
Apr 2, 2008
Sold by
Fuentes Ruben
Bought by
Stevens Michael D
Current Estimated Value
Home Financials for this Owner
Home Financials are based on the most recent Mortgage that was taken out on this home.
Original Mortgage
$92,050
Outstanding Balance
$58,456
Interest Rate
6.19%
Mortgage Type
FHA
Estimated Equity
$79,859
Purchase Details
Closed on
Aug 19, 2005
Sold by
Rhodes Matthew Jason
Bought by
Fuentes Ruben and Fuentes Araceli
Home Financials for this Owner
Home Financials are based on the most recent Mortgage that was taken out on this home.
Original Mortgage
$63,650
Interest Rate
5.65%
Mortgage Type
New Conventional
Purchase Details
Closed on
Jul 21, 2005
Sold by
Owens William Alvin and Owens Betty Sue
Bought by
Propst Robert F and Revoc Mary
Home Financials for this Owner
Home Financials are based on the most recent Mortgage that was taken out on this home.
Original Mortgage
$63,650
Interest Rate
5.65%
Mortgage Type
New Conventional
Create a Home Valuation Report for This Property
The Home Valuation Report is an in-depth analysis detailing your home's value as well as a comparison with similar homes in the area
Home Values in the Area
Average Home Value in this Area
Purchase History
| Date | Buyer | Sale Price | Title Company |
|---|---|---|---|
| Stevens Michael D | $93,000 | First American Title & Abstr | |
| Fuentes Ruben | $67,000 | Metro Abstract & Title | |
| Propst Robert F | $27,500 | None Available |
Source: Public Records
Mortgage History
| Date | Status | Borrower | Loan Amount |
|---|---|---|---|
| Open | Stevens Michael D | $92,050 | |
| Previous Owner | Fuentes Ruben | $63,650 |
Source: Public Records
Tax History
| Year | Tax Paid | Tax Assessment Tax Assessment Total Assessment is a certain percentage of the fair market value that is determined by local assessors to be the total taxable value of land and additions on the property. | Land | Improvement |
|---|---|---|---|---|
| 2025 | $1,555 | $17,085 | $349 | $16,736 |
| 2024 | $1,503 | $16,270 | $332 | $15,938 |
| 2023 | $1,431 | $15,496 | $286 | $15,210 |
| 2022 | $1,360 | $14,759 | $204 | $14,555 |
| 2021 | $242 | $11,090 | $164 | $10,926 |
| 2020 | $236 | $2,488 | $164 | $2,324 |
| 2019 | $194 | $2,370 | $164 | $2,206 |
| 2018 | $195 | $2,257 | $164 | $2,093 |
| 2017 | $183 | $2,150 | $164 | $1,986 |
| 2016 | $173 | $9,849 | $164 | $9,685 |
| 2015 | -- | $9,380 | $407 | $8,973 |
| 2014 | -- | $10,353 | $1,120 | $9,233 |
Source: Public Records
Map
Nearby Homes
- 0 SW 4th St
- 1104 SW 4th St
- 74499 280
- 0 SW 2nd St
- 0 S Grant Ave
- 0 S Taylor Ave
- 906 NW 1st St
- 1 Ash Ave
- 0 SW 9th St Unit 2537168
- 1406 S Filmore Ave
- 807 NW 3rd St
- 0 S Polk Ave
- 405 Mockingbird Ln
- 1204 SW 12th Place
- 25820 Oklahoma 51
- 2 N Wagoner Ave
- 0 SW 13th St
- 1208 SW 14th Ct
- 1421 S Hayes Ave
- 0 S Wagoner Ave
- 1005 SW 4th St
- 507 S Johnson Ave
- 1003 SW 4th St
- null SW 4th St
- 1101 SW 4th St
- 1101 SW 4th St
- 1001 SW 4th St
- 1010 SW 4th St
- 509 S Lincoln Ave
- 1008 SW 4th St
- 1004 SW 4th St
- 1102 SW 4th St
- 1002 SW 4th St
- 1106 SW 4th St
- 408 S Lincoln Ave
- 603 S Johnson Ave
- 1003 SW 5th St
- 602 S Lincoln Ave
- 1108 SW 4th St
- 907 SW 4th St
Your Personal Tour Guide
Ask me questions while you tour the home.