Estimated Value: $234,657 - $248,000
3
Beds
3
Baths
1,635
Sq Ft
$148/Sq Ft
Est. Value
About This Home
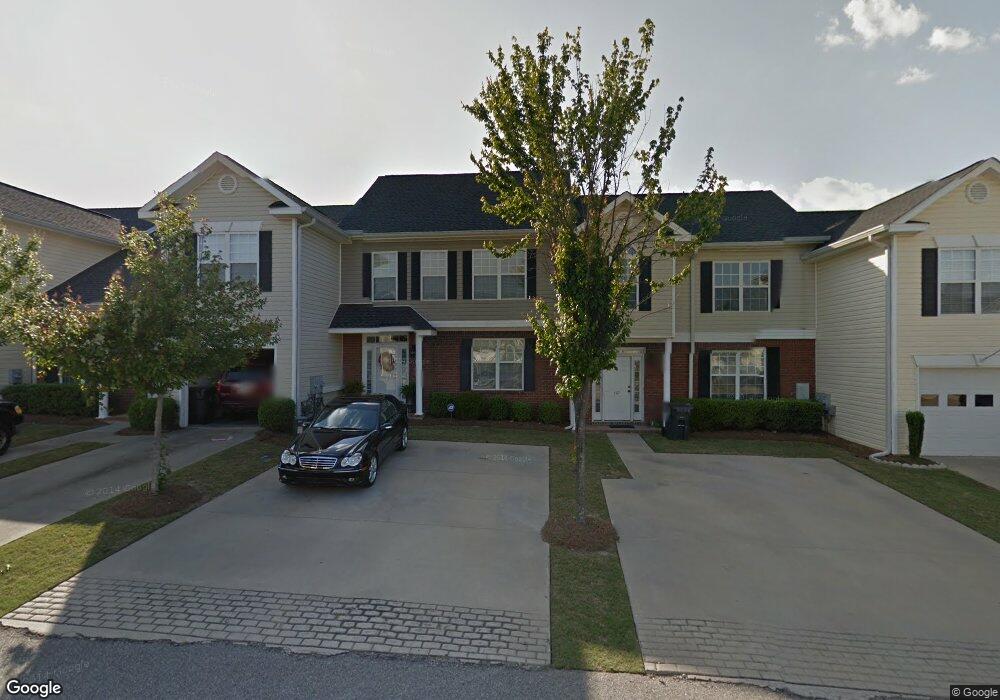
This home is located at 405 Snead Way, Evans, GA 30809 and is currently estimated at $241,914, approximately $147 per square foot. 405 Snead Way is a home located in Columbia County with nearby schools including River Ridge Elementary School, Stallings Island Middle School, and Lakeside High School.
Ownership History
Date
Name
Owned For
Owner Type
Purchase Details
Closed on
Mar 16, 2009
Sold by
Wall David A
Bought by
Curtis Anita B
Current Estimated Value
Home Financials for this Owner
Home Financials are based on the most recent Mortgage that was taken out on this home.
Original Mortgage
$143,360
Outstanding Balance
$91,158
Interest Rate
5.13%
Mortgage Type
New Conventional
Estimated Equity
$150,757
Purchase Details
Closed on
Nov 30, 2006
Sold by
Lewis Christopher
Bought by
Wall David A
Home Financials for this Owner
Home Financials are based on the most recent Mortgage that was taken out on this home.
Original Mortgage
$136,705
Interest Rate
6%
Mortgage Type
New Conventional
Purchase Details
Closed on
May 28, 2004
Sold by
Sid Beckum Construction Inc
Bought by
Webb Lewis Christopher and Webb Lewis Loren
Home Financials for this Owner
Home Financials are based on the most recent Mortgage that was taken out on this home.
Original Mortgage
$93,520
Interest Rate
5.89%
Mortgage Type
Purchase Money Mortgage
Create a Home Valuation Report for This Property
The Home Valuation Report is an in-depth analysis detailing your home's value as well as a comparison with similar homes in the area
Home Values in the Area
Average Home Value in this Area
Purchase History
| Date | Buyer | Sale Price | Title Company |
|---|---|---|---|
| Curtis Anita B | $140,000 | -- | |
| Wall David A | $143,900 | -- | |
| Webb Lewis Christopher | $116,900 | -- |
Source: Public Records
Mortgage History
| Date | Status | Borrower | Loan Amount |
|---|---|---|---|
| Open | Curtis Anita B | $143,360 | |
| Previous Owner | Wall David A | $136,705 | |
| Previous Owner | Webb Lewis Christopher | $93,520 | |
| Closed | Webb Lewis Christopher | $23,380 |
Source: Public Records
Tax History
| Year | Tax Paid | Tax Assessment Tax Assessment Total Assessment is a certain percentage of the fair market value that is determined by local assessors to be the total taxable value of land and additions on the property. | Land | Improvement |
|---|---|---|---|---|
| 2025 | $2,169 | $91,006 | $21,704 | $69,302 |
| 2024 | $2,174 | $87,038 | $19,104 | $67,934 |
| 2023 | $2,174 | $74,761 | $18,304 | $56,457 |
| 2022 | $1,827 | $70,366 | $15,504 | $54,862 |
| 2021 | $1,671 | $61,482 | $13,704 | $47,778 |
| 2020 | $1,611 | $58,074 | $12,504 | $45,570 |
| 2019 | $1,549 | $55,825 | $12,204 | $43,621 |
| 2018 | $1,511 | $54,283 | $11,604 | $42,679 |
| 2017 | $1,489 | $53,316 | $11,904 | $41,412 |
| 2016 | $1,332 | $49,448 | $11,180 | $38,268 |
| 2015 | $1,344 | $49,790 | $10,580 | $39,210 |
| 2014 | $1,362 | $49,852 | $9,380 | $40,472 |
Source: Public Records
Map
Nearby Homes
- 421 Snead Way
- 104 Palmer Ct
- 4249 Deerwood Ln
- 934 Deercrest Cir
- 808 Shackleford Place
- 846 Willow Lake
- 4305 Southern Pines Dr
- 4222 Deerwood Ln
- 4139 Hammonds Ferry
- 876 Willow Lake
- 839 Prairie Ln
- 928 Hunting Horn Way W
- 612 Emerald Crossing
- 836 Park Chase Dr
- 207 Oleander Trail
- 735 Michaels Creek
- 905 Nerium Trail
- 958 Hunting Horn Way W
- 218 Ryan Ln
- 628 Emerald Crossing
- 403 Snead Way
- 407 Snead Way
- 401 Snead Way
- 409 Snead Way
- 413 Snead Way
- 404 Snead Way
- 406 Snead Way
- 402 Snead Way
- 530 Southern Hills Dr
- 528 Southern Hills Dr
- 408 Snead Way
- 526 Southern Hills Dr
- 415 Snead Way
- 536 Southern Hills Dr
- 410 Snead Way
- 400 Snead Way
- 538 Southern Hills Dr
- 417 Snead Way
- 412 Snead Way
- 414 Snead Way
Your Personal Tour Guide
Ask me questions while you tour the home.