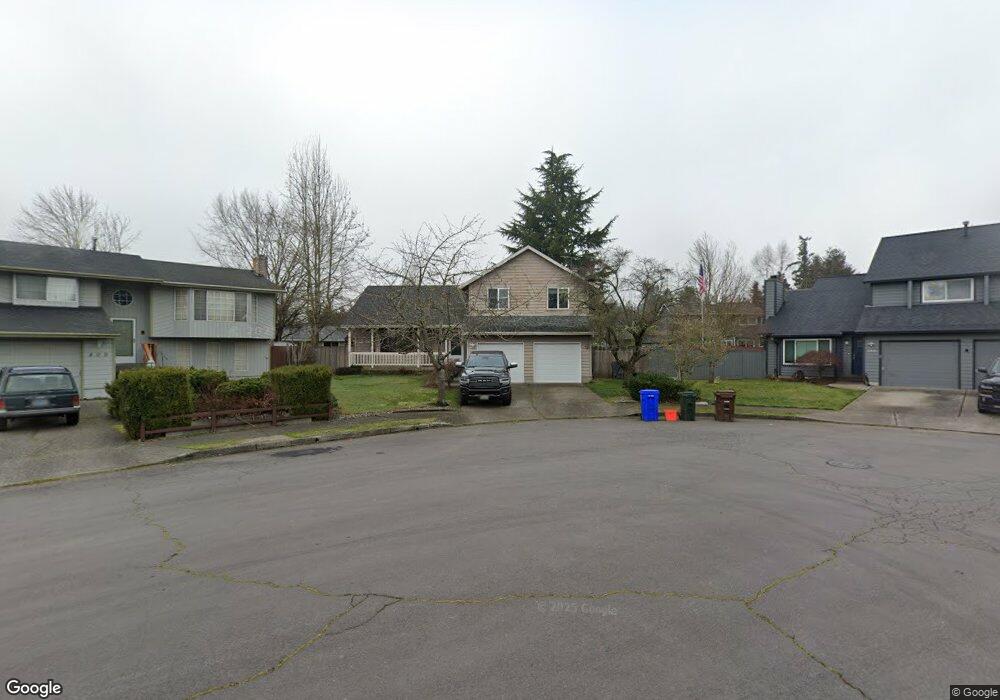
405 SW Lillyben Ave Gresham, OR 97080
Hollybrook NeighborhoodEstimated Value: $469,000 - $497,000
3
Beds
3
Baths
1,830
Sq Ft
$263/Sq Ft
Est. Value
About This Home
This home is located at 405 SW Lillyben Ave, Gresham, OR 97080 and is currently estimated at $481,910, approximately $263 per square foot. 405 SW Lillyben Ave is a home located in Multnomah County with nearby schools including Hollydale Elementary School, Clear Creek Middle School, and Gresham High School.
Ownership History
Date
Name
Owned For
Owner Type
Purchase Details
Closed on
Oct 22, 2001
Sold by
Spicer Darrel W
Bought by
Taylor Mark H and Taylor Laura D
Current Estimated Value
Home Financials for this Owner
Home Financials are based on the most recent Mortgage that was taken out on this home.
Original Mortgage
$170,773
Outstanding Balance
$66,058
Interest Rate
6.88%
Mortgage Type
FHA
Estimated Equity
$415,852
Purchase Details
Closed on
Jul 17, 2001
Sold by
Kitatake Constance
Bought by
Spicer Darrel W and Spicer Mary L
Purchase Details
Closed on
Dec 28, 1995
Sold by
Barry Connie G
Bought by
Barry Constance G
Home Financials for this Owner
Home Financials are based on the most recent Mortgage that was taken out on this home.
Original Mortgage
$97,500
Interest Rate
7.37%
Mortgage Type
Purchase Money Mortgage
Purchase Details
Closed on
Nov 23, 1993
Sold by
Bridwell Margaret A
Bought by
Barry Connie G
Create a Home Valuation Report for This Property
The Home Valuation Report is an in-depth analysis detailing your home's value as well as a comparison with similar homes in the area
Home Values in the Area
Average Home Value in this Area
Purchase History
| Date | Buyer | Sale Price | Title Company |
|---|---|---|---|
| Taylor Mark H | $173,500 | Chicago Title Insurance Co | |
| Spicer Darrel W | $149,000 | Chicago Title Insurance Co | |
| Barry Constance G | -- | First American Title Ins Co | |
| Barry Connie G | $118,000 | First American Title Ins Co |
Source: Public Records
Mortgage History
| Date | Status | Borrower | Loan Amount |
|---|---|---|---|
| Open | Taylor Mark H | $170,773 | |
| Previous Owner | Barry Constance G | $97,500 |
Source: Public Records
Tax History
| Year | Tax Paid | Tax Assessment Tax Assessment Total Assessment is a certain percentage of the fair market value that is determined by local assessors to be the total taxable value of land and additions on the property. | Land | Improvement |
|---|---|---|---|---|
| 2025 | $5,585 | $274,450 | -- | -- |
| 2024 | $5,346 | $266,460 | -- | -- |
| 2023 | $4,871 | $258,700 | $0 | $0 |
| 2022 | $4,735 | $251,170 | $0 | $0 |
| 2021 | $4,615 | $243,860 | $0 | $0 |
| 2020 | $4,343 | $236,760 | $0 | $0 |
| 2019 | $4,229 | $229,870 | $0 | $0 |
| 2018 | $4,032 | $223,180 | $0 | $0 |
| 2017 | $3,869 | $216,680 | $0 | $0 |
| 2016 | $3,411 | $210,370 | $0 | $0 |
| 2015 | $3,337 | $204,250 | $0 | $0 |
| 2014 | $3,235 | $198,310 | $0 | $0 |
Source: Public Records
Map
Nearby Homes
- 44 SW Birdsdale Dr
- 21 NW Mawrcrest Ave
- 63 NW Mawrcrest Ave
- 85 NW Mawrcrest Ave
- 181 NW Mawrcrest Ave
- 185 NW Mawrcrest Ave
- 230 NW Mawrcrest Ave
- 236 NW Mawrcrest Ave
- 256 NW Mawrcrest Ave
- 284 NW Mawrcrest Ave
- 2543 NW 2nd Terrace
- 2590 NW 2nd Terrace
- 2095 NW 3rd St
- 1960 SW 13th Ct
- 163 SW Sandlewood Loop
- 1175 SW Chastain Dr
- 3412 NW 1st St
- 1113 W Powell Blvd
- 159 SW Florence Ave Unit 64
- 159 SW Florence Ave
- 409 SW Lillyben Ave
- 2232 SW 4th St
- 400 SW Lillyben Ave
- 2222 SW 4th St
- 2302 SW 4th St
- 411 SW Lillyben Ave Unit 5
- 2312 SW 4th St
- 402 SW Lillyben Ave
- 2212 SW 4th St
- 422 SW Lillyben Ave
- 2322 SW 4th St
- 412 SW Lillyben Ave
- 2231 SW 4th St
- 2301 SW 4th St
- 431 SW Lillyben Ave
- 338 SW Lillyben Ave
- 424 SW Mawrcrest Dr
- 432 SW Lillyben Ave
- 429 SW Birdsdale Dr
- 417 SW Birdsdale Dr
Your Personal Tour Guide
Ask me questions while you tour the home.