Estimated Value: $284,000 - $464,000
3
Beds
1
Bath
998
Sq Ft
$410/Sq Ft
Est. Value
About This Home
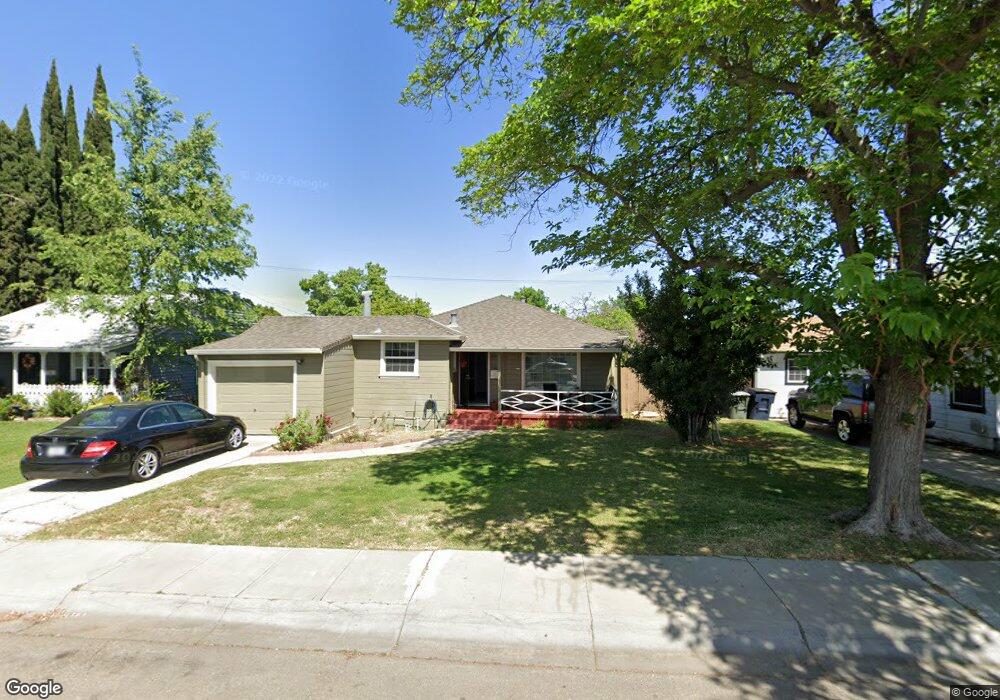
This home is located at 405 W 22nd St, Tracy, CA 95376 and is currently estimated at $409,076, approximately $409 per square foot. 405 W 22nd St is a home located in San Joaquin County with nearby schools including Central Elementary School, Merrill F. West High School, and Primary Charter School.
Ownership History
Date
Name
Owned For
Owner Type
Purchase Details
Closed on
Nov 21, 2012
Sold by
Sechini Paul L and Sechini Paul L
Bought by
Salas David A
Current Estimated Value
Home Financials for this Owner
Home Financials are based on the most recent Mortgage that was taken out on this home.
Original Mortgage
$136,800
Interest Rate
3.33%
Mortgage Type
New Conventional
Purchase Details
Closed on
Jun 5, 2001
Sold by
Brown Raymond J and Brown Judy A
Bought by
Brown Raymond J and Brown Judith A
Create a Home Valuation Report for This Property
The Home Valuation Report is an in-depth analysis detailing your home's value as well as a comparison with similar homes in the area
Home Values in the Area
Average Home Value in this Area
Purchase History
| Date | Buyer | Sale Price | Title Company |
|---|---|---|---|
| Salas David A | $155,000 | First American Title Company | |
| Brown Raymond J | -- | -- |
Source: Public Records
Mortgage History
| Date | Status | Borrower | Loan Amount |
|---|---|---|---|
| Previous Owner | Salas David A | $136,800 |
Source: Public Records
Tax History Compared to Growth
Tax History
| Year | Tax Paid | Tax Assessment Tax Assessment Total Assessment is a certain percentage of the fair market value that is determined by local assessors to be the total taxable value of land and additions on the property. | Land | Improvement |
|---|---|---|---|---|
| 2025 | $2,358 | $203,664 | $103,174 | $100,490 |
| 2024 | $2,173 | $199,671 | $101,151 | $98,520 |
| 2023 | $2,139 | $195,757 | $99,168 | $96,589 |
| 2022 | $2,096 | $191,920 | $97,224 | $94,696 |
| 2021 | $2,072 | $188,158 | $95,318 | $92,840 |
| 2020 | $2,058 | $186,230 | $94,341 | $91,889 |
| 2019 | $2,026 | $182,580 | $92,492 | $90,088 |
| 2018 | $1,992 | $179,001 | $90,679 | $88,322 |
| 2017 | $1,893 | $175,492 | $88,901 | $86,591 |
| 2016 | $1,916 | $172,052 | $87,158 | $84,894 |
| 2014 | $1,555 | $144,100 | $42,900 | $101,200 |
Source: Public Records
Map
Nearby Homes
- 1930 Wall St
- 1823 Wall St
- 2214 Morningside Ct
- 2198 Walsingham Ct
- 535 W Carlton Way
- 2270 Chester Dr
- 80 E Portola Way Unit 105
- 1506 Madison Ave
- 41 W Kavanagh Ave
- 2935 Holly Dr
- 110 E Kavanagh Ave
- 239 E 20th St
- 3241 Arnaudo Ln
- 1215 Linda Place
- 1865 Newport Ct
- 262 Clover Rd
- 435 W Clover Rd
- 1704 East St
- 335 W Clover Rd
- 812 W Clover Rd Unit 51