Estimated Value: $500,000 - $545,000
3
Beds
1
Bath
1,674
Sq Ft
$312/Sq Ft
Est. Value
About This Home
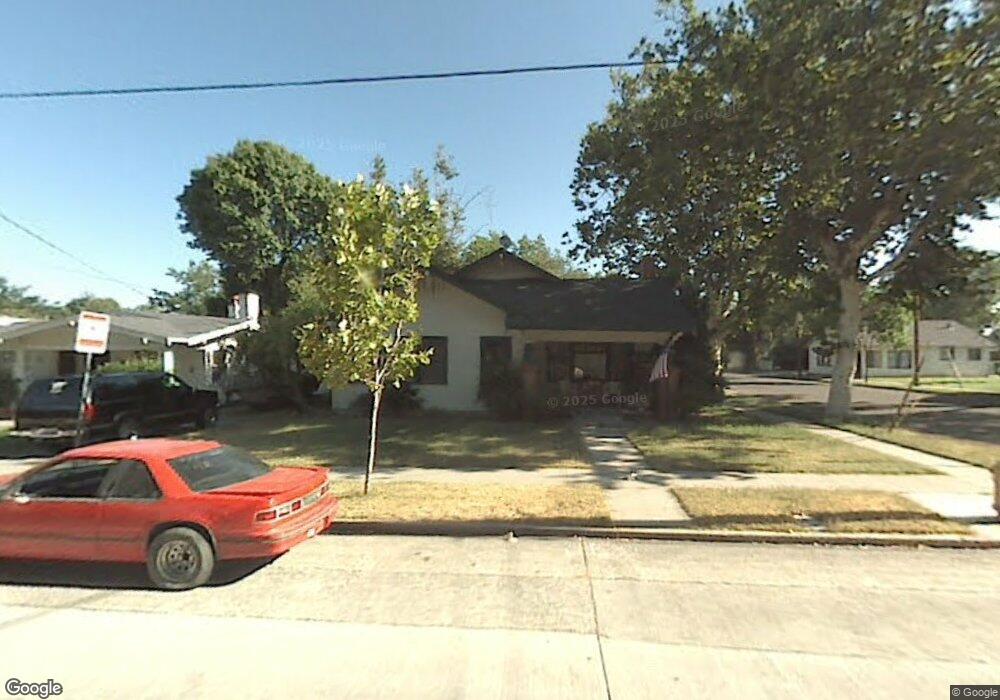
This home is located at 405 W Highland Ave, Tracy, CA 95376 and is currently estimated at $522,272, approximately $311 per square foot. 405 W Highland Ave is a home located in San Joaquin County with nearby schools including Central Elementary School, Monte Vista Middle School, and Tracy High School.
Ownership History
Date
Name
Owned For
Owner Type
Purchase Details
Closed on
Jun 27, 2011
Sold by
Federal Home Loan Mortgage Corporation
Bought by
Homan William A and Homan Susan R
Current Estimated Value
Purchase Details
Closed on
Apr 14, 2011
Sold by
Linehan Cathy J
Bought by
Federal Home Loan Mortgage Corporation
Purchase Details
Closed on
Feb 23, 2007
Sold by
Linehan Lauren R
Bought by
Linehan Cathy J
Home Financials for this Owner
Home Financials are based on the most recent Mortgage that was taken out on this home.
Original Mortgage
$304,000
Interest Rate
6.12%
Mortgage Type
New Conventional
Purchase Details
Closed on
Nov 6, 1995
Sold by
Broussard Gary M and Broussard Mary J
Bought by
Linehan Lauren R and Linehan Cathy J
Home Financials for this Owner
Home Financials are based on the most recent Mortgage that was taken out on this home.
Original Mortgage
$147,400
Interest Rate
7.62%
Create a Home Valuation Report for This Property
The Home Valuation Report is an in-depth analysis detailing your home's value as well as a comparison with similar homes in the area
Home Values in the Area
Average Home Value in this Area
Purchase History
| Date | Buyer | Sale Price | Title Company |
|---|---|---|---|
| Homan William A | $123,000 | Lsi Title Company | |
| Federal Home Loan Mortgage Corporation | $111,231 | None Available | |
| Linehan Cathy J | -- | First American Title Co | |
| Linehan Lauren R | $150,000 | Chicago Title Co |
Source: Public Records
Mortgage History
| Date | Status | Borrower | Loan Amount |
|---|---|---|---|
| Previous Owner | Linehan Cathy J | $304,000 | |
| Previous Owner | Linehan Lauren R | $147,400 |
Source: Public Records
Tax History Compared to Growth
Tax History
| Year | Tax Paid | Tax Assessment Tax Assessment Total Assessment is a certain percentage of the fair market value that is determined by local assessors to be the total taxable value of land and additions on the property. | Land | Improvement |
|---|---|---|---|---|
| 2025 | $1,830 | $157,577 | $38,432 | $119,145 |
| 2024 | $1,686 | $154,488 | $37,679 | $116,809 |
| 2023 | $1,660 | $151,460 | $36,941 | $114,519 |
| 2022 | $1,627 | $148,491 | $36,217 | $112,274 |
| 2021 | $1,608 | $145,580 | $35,507 | $110,073 |
| 2020 | $1,597 | $144,088 | $35,143 | $108,945 |
| 2019 | $1,572 | $141,263 | $34,454 | $106,809 |
| 2018 | $1,546 | $138,494 | $33,779 | $104,715 |
| 2017 | $1,469 | $135,779 | $33,117 | $102,662 |
| 2016 | $1,487 | $133,117 | $32,468 | $100,649 |
| 2014 | $1,390 | $128,550 | $31,354 | $97,196 |
Source: Public Records
Map
Nearby Homes
- 1228 Bessie Ave
- 1241 Parker Ave Unit 1
- 1212 Walnut St
- 1561 Bessie Ave
- 835 W Beverly Place
- 262 W Lowell Ave
- 242 W Lowell Ave
- 228 W Lowell Ave
- 1436 Chester Dr
- 18 W 8th St
- 517 Rockingham Way
- 1427 Audrey Dr
- 1792 Chester Dr
- 16 Pereira Ave
- 1600 Valerie Ln
- 610 Tennis Ln
- 2840-2896 Holly Dr
- 500 Chestnut Ave
- 2192 Wildflower Ct
- 110 W 23rd St
- 411 W Highland Ave
- 419 W Highland Ave
- 363 W Highland Ave
- 929931 Wall St
- 427 W Highland Ave
- 351 W Highland Ave
- 410 W Highland Ave
- 1337 Wall St
- 435 W Highland Ave
- 335 W Highland Ave
- 1237 Wall St
- 1345 Wall St
- 360 W Highland Ave
- 1338 Wall St
- 420 W Highland Ave
- 350 W Highland Ave
- 443 W Highland Ave
- 428 W Highland Ave
- 331 W Highland Ave
- 1229 Wall St