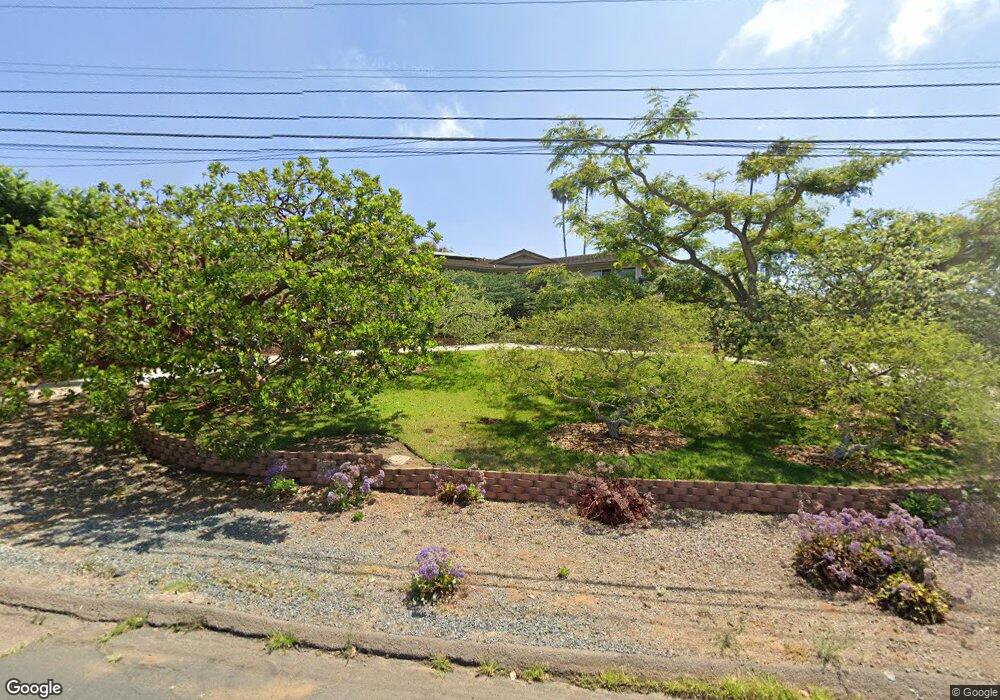
4050 Skyline Rd Carlsbad, CA 92008
Olde Carlsbad NeighborhoodEstimated Value: $1,768,203 - $2,274,000
4
Beds
3
Baths
2,606
Sq Ft
$802/Sq Ft
Est. Value
About This Home
This home is located at 4050 Skyline Rd, Carlsbad, CA 92008 and is currently estimated at $2,091,301, approximately $802 per square foot. 4050 Skyline Rd is a home located in San Diego County with nearby schools including Magnolia Elementary, Carlsbad High School, and Sage Creek High.
Ownership History
Date
Name
Owned For
Owner Type
Purchase Details
Closed on
Apr 4, 2017
Sold by
Mcdowell David J and Mcdowell Anna J
Bought by
Mcdowell David J and Mcdowell Anna J
Current Estimated Value
Purchase Details
Closed on
Sep 23, 2010
Sold by
Mcdowell Richard J and Mcdowell Barbara M
Bought by
Mcdowell David J
Purchase Details
Closed on
Oct 24, 2002
Sold by
Mcdowell Richard J and Mcdowell Barbara M
Bought by
Mcdowell Richard J and Mcdowell Barbara M
Create a Home Valuation Report for This Property
The Home Valuation Report is an in-depth analysis detailing your home's value as well as a comparison with similar homes in the area
Home Values in the Area
Average Home Value in this Area
Purchase History
| Date | Buyer | Sale Price | Title Company |
|---|---|---|---|
| Mcdowell David J | -- | None Available | |
| Mcdowell David J | -- | None Available | |
| Mcdowell David J | -- | None Available | |
| Mcdowell David J | -- | None Available | |
| Mcdowell Richard J | -- | -- | |
| Mcdowell Richard J | -- | -- |
Source: Public Records
Tax History Compared to Growth
Tax History
| Year | Tax Paid | Tax Assessment Tax Assessment Total Assessment is a certain percentage of the fair market value that is determined by local assessors to be the total taxable value of land and additions on the property. | Land | Improvement |
|---|---|---|---|---|
| 2025 | $1,735 | $164,667 | $47,099 | $117,568 |
| 2024 | $1,735 | $161,439 | $46,176 | $115,263 |
| 2023 | $1,724 | $158,274 | $45,271 | $113,003 |
| 2022 | $1,696 | $155,172 | $44,384 | $110,788 |
| 2021 | $1,683 | $152,130 | $43,514 | $108,616 |
| 2020 | $1,671 | $150,571 | $43,068 | $107,503 |
| 2019 | $1,641 | $147,620 | $42,224 | $105,396 |
| 2018 | $1,573 | $144,727 | $41,397 | $103,330 |
| 2017 | $1,622 | $141,890 | $40,586 | $101,304 |
| 2016 | $1,558 | $139,109 | $39,791 | $99,318 |
| 2015 | $1,552 | $137,021 | $39,194 | $97,827 |
| 2014 | $1,528 | $134,338 | $38,427 | $95,911 |
Source: Public Records
Map
Nearby Homes
- 1816 E Pointe Ave
- 3920 Holly Brae Ln
- 4143 Sunnyhill Dr
- 4623 Telescope Ave
- 4427 Trieste Dr
- 4640 Sunburst Rd
- 3736 Donna Ct
- 3721 Donna Ct
- 4000 James Dr
- 4439 Salisbury Dr
- 2591 Regent Rd Unit 52
- 0 Sunny Creek Unit PI25230627
- 1741 Bruce Rd
- 4814 Refugio Ave
- 4459 Dorchester Place
- 3975 Stella Maris Ln
- 0 Hoover St
- 4781 Argosy Ln
- 4672 Catmint Ln
- 2508 Chamomile Ln
- 4056 Skyline Rd
- 4040 Skyline Rd
- 4060 Skyline Rd
- 4024 Skyline Rd
- 4061 Skyline Rd
- 1775 E Pointe Ave
- 4051 Skyline Rd
- 4080 Skyline Rd
- 4033 Skyline Rd
- 1769 E Pointe Ave
- 4073 Skyline Rd
- 1763 E Pointe Ave
- 4014 Skyline Rd
- 4027 Skyline Rd
- 1757 E Pointe Ave
- 1795 E Pointe Ave
- 1815 Tamarack Ave
- 4079 Skyline Rd
- 1794 E Pointe Ave
- 1788 E Pointe Ave