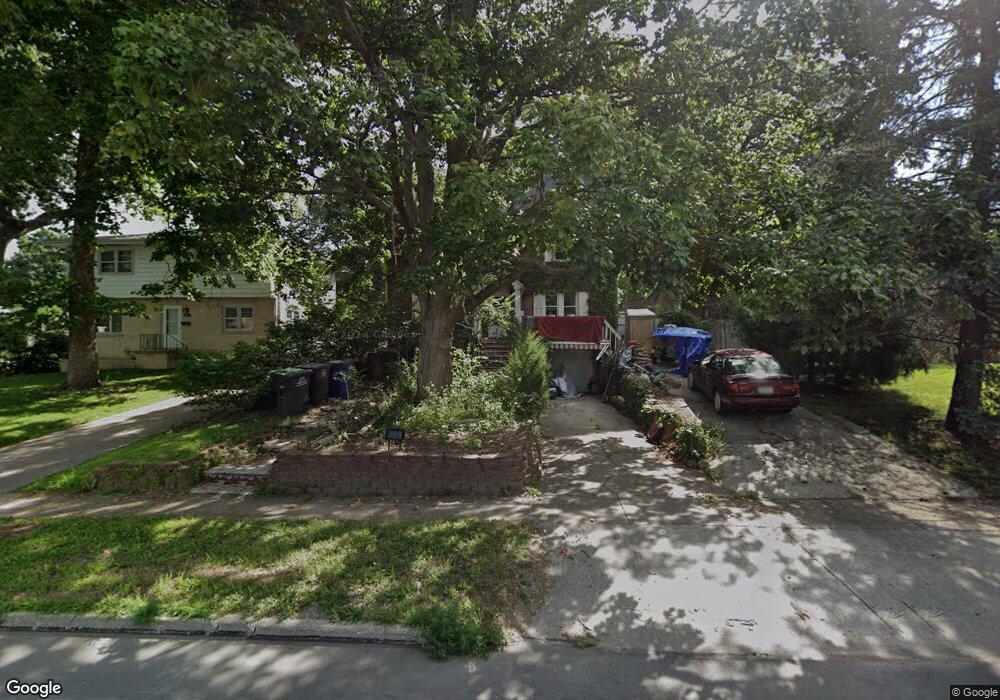
4051 12th St Des Moines, IA 50313
Oak Park NeighborhoodEstimated Value: $232,078 - $258,000
4
Beds
2
Baths
2,019
Sq Ft
$122/Sq Ft
Est. Value
About This Home
This home is located at 4051 12th St, Des Moines, IA 50313 and is currently estimated at $246,020, approximately $121 per square foot. 4051 12th St is a home located in Polk County with nearby schools including Oak Park Elementary School, Harding Middle School, and North High School.
Ownership History
Date
Name
Owned For
Owner Type
Purchase Details
Closed on
May 24, 2004
Sold by
Stefani Anthony M
Bought by
Rustan Douglas
Current Estimated Value
Home Financials for this Owner
Home Financials are based on the most recent Mortgage that was taken out on this home.
Original Mortgage
$87,200
Outstanding Balance
$41,863
Interest Rate
6.06%
Mortgage Type
Purchase Money Mortgage
Estimated Equity
$204,157
Purchase Details
Closed on
Oct 24, 1998
Sold by
Cretsinger Samuel Douglas and Cretsinger Connie Marlene
Bought by
Stefani Anthony M
Home Financials for this Owner
Home Financials are based on the most recent Mortgage that was taken out on this home.
Original Mortgage
$92,843
Interest Rate
6.78%
Mortgage Type
FHA
Create a Home Valuation Report for This Property
The Home Valuation Report is an in-depth analysis detailing your home's value as well as a comparison with similar homes in the area
Home Values in the Area
Average Home Value in this Area
Purchase History
| Date | Buyer | Sale Price | Title Company |
|---|---|---|---|
| Rustan Douglas | $108,500 | -- | |
| Stefani Anthony M | $93,500 | -- |
Source: Public Records
Mortgage History
| Date | Status | Borrower | Loan Amount |
|---|---|---|---|
| Open | Rustan Douglas | $87,200 | |
| Previous Owner | Stefani Anthony M | $92,843 | |
| Closed | Rustan Douglas | $21,800 |
Source: Public Records
Tax History Compared to Growth
Tax History
| Year | Tax Paid | Tax Assessment Tax Assessment Total Assessment is a certain percentage of the fair market value that is determined by local assessors to be the total taxable value of land and additions on the property. | Land | Improvement |
|---|---|---|---|---|
| 2025 | $3,954 | $255,400 | $36,500 | $218,900 |
| 2024 | $3,954 | $220,100 | $31,400 | $188,700 |
| 2023 | $4,392 | $220,100 | $31,400 | $188,700 |
| 2022 | $4,356 | $198,600 | $29,400 | $169,200 |
| 2021 | $4,218 | $198,600 | $29,400 | $169,200 |
| 2020 | $4,374 | $180,900 | $27,000 | $153,900 |
| 2019 | $3,898 | $180,900 | $27,000 | $153,900 |
| 2018 | $3,850 | $156,800 | $23,200 | $133,600 |
| 2017 | $3,468 | $156,800 | $23,200 | $133,600 |
| 2016 | $3,372 | $140,000 | $20,200 | $119,800 |
| 2015 | $3,372 | $140,000 | $20,200 | $119,800 |
| 2014 | $3,328 | $137,300 | $19,400 | $117,900 |
Source: Public Records
Map
Nearby Homes