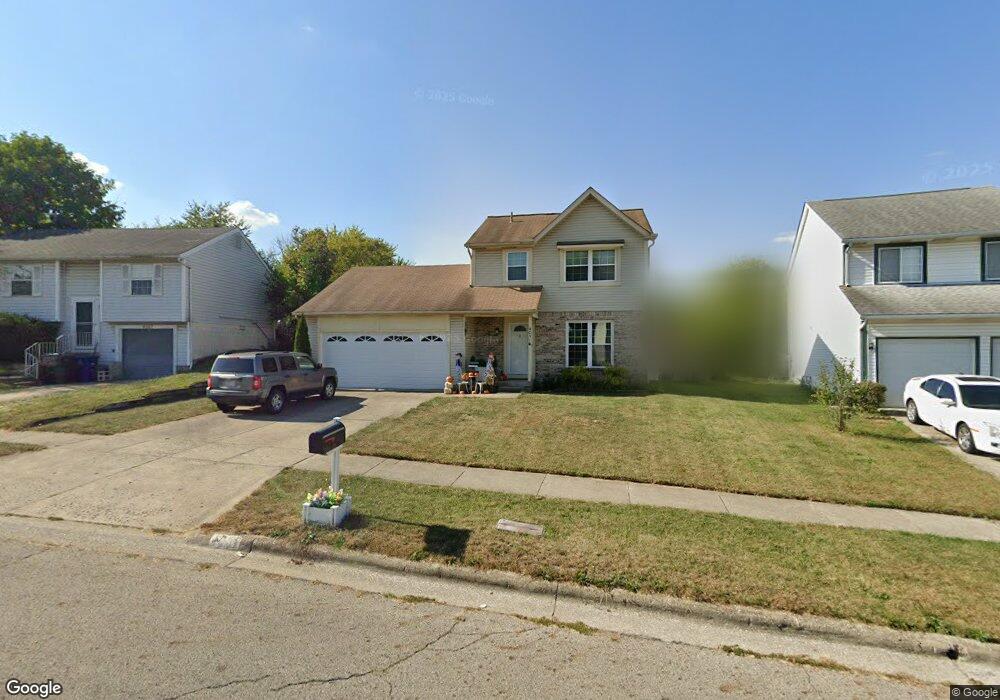
4051 Plateau St Unit 3 Columbus, OH 43207
Obetz-Lockbourne NeighborhoodEstimated Value: $239,000 - $270,000
3
Beds
3
Baths
1,220
Sq Ft
$206/Sq Ft
Est. Value
About This Home
This home is located at 4051 Plateau St Unit 3, Columbus, OH 43207 and is currently estimated at $251,437, approximately $206 per square foot. 4051 Plateau St Unit 3 is a home located in Franklin County with nearby schools including Groveport Madison High School, South Columbus Preparatory Academy at Southfield, and Groveport Community School.
Ownership History
Date
Name
Owned For
Owner Type
Purchase Details
Closed on
Aug 29, 2017
Sold by
Meleshchuk Igor V
Bought by
Crachiolo James and Cracchiolo Elizabeth
Current Estimated Value
Home Financials for this Owner
Home Financials are based on the most recent Mortgage that was taken out on this home.
Original Mortgage
$148,117
Outstanding Balance
$123,788
Interest Rate
3.93%
Mortgage Type
VA
Estimated Equity
$127,649
Purchase Details
Closed on
Sep 19, 2016
Sold by
Bynes Michael A and Waxler Katherine A
Bought by
Household Realty Corp
Purchase Details
Closed on
Aug 1, 2016
Sold by
Household Realty Corporation
Bought by
Meleshchuk Igor V
Purchase Details
Closed on
Aug 31, 1993
Bought by
Bynes Michael A and Bynes Karne E
Purchase Details
Closed on
Jun 12, 1989
Purchase Details
Closed on
Mar 22, 1989
Create a Home Valuation Report for This Property
The Home Valuation Report is an in-depth analysis detailing your home's value as well as a comparison with similar homes in the area
Home Values in the Area
Average Home Value in this Area
Purchase History
| Date | Buyer | Sale Price | Title Company |
|---|---|---|---|
| Crachiolo James | $145,000 | None Available | |
| Household Realty Corp | -- | Independent Title Svcs Inc B | |
| Meleshchuk Igor V | $85,000 | None Available | |
| Bynes Michael A | $83,500 | -- | |
| -- | $78,900 | -- | |
| -- | $10,000 | -- |
Source: Public Records
Mortgage History
| Date | Status | Borrower | Loan Amount |
|---|---|---|---|
| Open | Crachiolo James | $148,117 |
Source: Public Records
Tax History Compared to Growth
Tax History
| Year | Tax Paid | Tax Assessment Tax Assessment Total Assessment is a certain percentage of the fair market value that is determined by local assessors to be the total taxable value of land and additions on the property. | Land | Improvement |
|---|---|---|---|---|
| 2024 | $3,256 | $76,790 | $19,250 | $57,540 |
| 2023 | $3,225 | $76,790 | $19,250 | $57,540 |
| 2022 | $2,523 | $49,980 | $7,980 | $42,000 |
| 2021 | $2,853 | $49,980 | $7,980 | $42,000 |
| 2020 | $2,556 | $49,980 | $7,980 | $42,000 |
| 2019 | $2,529 | $44,590 | $6,930 | $37,660 |
| 2018 | $2,278 | $44,590 | $6,930 | $37,660 |
| 2017 | $1,887 | $32,170 | $6,930 | $25,240 |
| 2016 | $2,036 | $30,280 | $5,780 | $24,500 |
| 2015 | $2,010 | $30,280 | $5,780 | $24,500 |
| 2014 | $1,939 | $30,280 | $5,780 | $24,500 |
| 2013 | $901 | $31,885 | $6,090 | $25,795 |
Source: Public Records
Map
Nearby Homes
- 2585 Millview Dr
- 3865 Pendent Ln
- 0 Alum Creek Dr Unit 225007823
- 2587 Winningwillow Dr
- 3724 Revolutionary Dr Unit 111
- 3622 Pendent Ln
- 2318 Rodger Rd
- 2629 Patrick Henry Ave Unit 40
- 2229 Maureen Blvd N
- 2222 Maureen Blvd S
- 4310 Charlotte Rd
- 2697 Meigs Dr
- 2693 Meigs Dr
- 3242 Mackinac Dr
- 2689 Meigs Dr
- 2685 Meigs Dr
- 2681 Meigs Dr
- 2690 Meigs Dr
- 2686 Meigs Dr
- 2682 Meigs Dr
- 4051 Plateau St
- 4057 Plateau St
- 4045 Plateau St
- 4067 Plateau St
- 4026 Planters Ct
- 4018 Planters Ct
- 4065 Plateau St
- 4066 Plateau St
- 4039 Plateau St
- 4034 Planters Ct Unit 334
- 2783 Moonlight Ln
- 4064 Plateau St
- 4048 Plateau St
- 4056 Plateau St
- 2775 Moonlight Ln
- 4073 Plateau St
- 2700 Buggywhip Ln
- 4075 Plateau St
- 4010 Planters Ct
- 4040 Plateau St