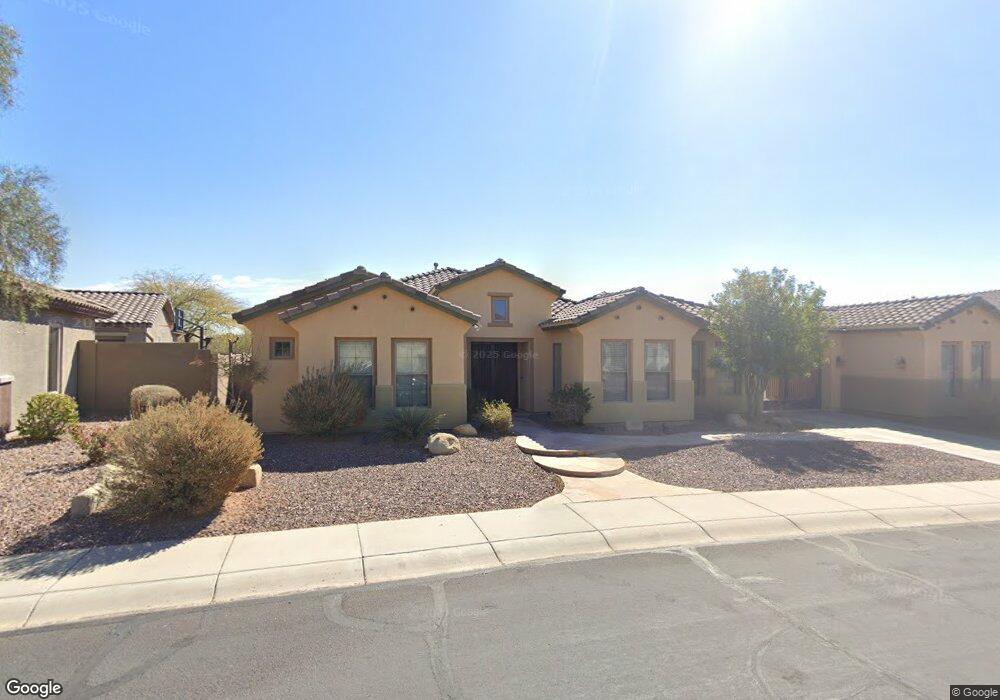
40513 N Travis Trail Unit 23 Phoenix, AZ 85086
Estimated Value: $826,246 - $1,008,000
5
Beds
3
Baths
3,363
Sq Ft
$276/Sq Ft
Est. Value
About This Home
This home is located at 40513 N Travis Trail Unit 23, Phoenix, AZ 85086 and is currently estimated at $929,062, approximately $276 per square foot. 40513 N Travis Trail Unit 23 is a home located in Maricopa County with nearby schools including Gavilan Peak Elementary School, Boulder Creek High School, and Caurus Academy.
Ownership History
Date
Name
Owned For
Owner Type
Purchase Details
Closed on
Feb 23, 2011
Sold by
Dieman Charles A and Dieman Robin L
Bought by
Wang Michael M and Wang Chiung Wen L
Current Estimated Value
Home Financials for this Owner
Home Financials are based on the most recent Mortgage that was taken out on this home.
Original Mortgage
$311,888
Outstanding Balance
$211,544
Interest Rate
4.75%
Mortgage Type
FHA
Estimated Equity
$717,518
Purchase Details
Closed on
Sep 28, 2010
Sold by
Critchlow Kit
Bought by
Dieman Charles A and Dieman Robin I
Purchase Details
Closed on
Mar 29, 2010
Sold by
Dieman Charles A and Dieman Robin I
Bought by
Critchlow Kit and Travis Revocable Family Trust
Purchase Details
Closed on
May 13, 2003
Sold by
Del Webbs Coventry Homes Inc
Bought by
Dieman Charles A and Dieman Robin I
Home Financials for this Owner
Home Financials are based on the most recent Mortgage that was taken out on this home.
Original Mortgage
$318,426
Interest Rate
5.71%
Mortgage Type
New Conventional
Create a Home Valuation Report for This Property
The Home Valuation Report is an in-depth analysis detailing your home's value as well as a comparison with similar homes in the area
Home Values in the Area
Average Home Value in this Area
Purchase History
| Date | Buyer | Sale Price | Title Company |
|---|---|---|---|
| Wang Michael M | $320,000 | Driggs Title Agency | |
| Dieman Charles A | -- | None Available | |
| Critchlow Kit | -- | None Available | |
| Dieman Charles A | $335,186 | Sun Title Agency Co | |
| Del Webbs Coventry Homes Inc | -- | Sun Title Agency Co |
Source: Public Records
Mortgage History
| Date | Status | Borrower | Loan Amount |
|---|---|---|---|
| Open | Wang Michael M | $311,888 | |
| Previous Owner | Dieman Charles A | $318,426 |
Source: Public Records
Tax History Compared to Growth
Tax History
| Year | Tax Paid | Tax Assessment Tax Assessment Total Assessment is a certain percentage of the fair market value that is determined by local assessors to be the total taxable value of land and additions on the property. | Land | Improvement |
|---|---|---|---|---|
| 2025 | $6,368 | $56,479 | -- | -- |
| 2024 | $5,952 | $53,789 | -- | -- |
| 2023 | $5,952 | $64,920 | $12,980 | $51,940 |
| 2022 | $5,687 | $50,160 | $10,030 | $40,130 |
| 2021 | $5,790 | $47,280 | $9,450 | $37,830 |
| 2020 | $5,658 | $44,820 | $8,960 | $35,860 |
| 2019 | $5,540 | $43,010 | $8,600 | $34,410 |
| 2018 | $5,361 | $41,080 | $8,210 | $32,870 |
| 2017 | $5,243 | $39,500 | $7,900 | $31,600 |
| 2016 | $4,706 | $36,730 | $7,340 | $29,390 |
| 2015 | $4,309 | $40,620 | $8,120 | $32,500 |
Source: Public Records
Map
Nearby Homes
- 2403 W Kit Carson Ct Unit 25
- 40614 N Laurel Valley Way Unit 37
- 40420 N Chase Oaks Way Unit 25
- 2407 W Warren Dr Unit 35
- 40128 N Hickok Trail Unit 29
- 2237 W Twain Dr Unit 39
- 2221 W River Rock Trail
- 40722 N Harbour Town Ct Unit 24
- 40131 N Mill Creek Way
- 40114 N Noble Hawk Ct
- 2251 W Clearview Trail Unit 49
- 40332 N High Noon Way
- 2030 W Clearview Trail Unit 51
- 2116 W Kuralt Dr
- 41202 N Rolling Green Way
- 41227 N Rolling Green Way
- 39826 N Mill Creek Ct Unit 43
- 1873 W Owens Way
- 41012 N Noble Hawk Way
- 40127 N Bridlewood Ct Unit 27
- 40507 N Travis Trail Unit 23
- 40519 N Travis Trail
- 40510 N Travis Trail Unit 23
- 40525 N Travis Trail
- 2228 W Webster Ct Unit 23
- 40419 N Copper Basin Trail
- 40502 N Travis Trail Unit 23
- 40404 N Blaze Trail
- 40531 N Travis Trail
- 40330 N Blaze Trail
- 40410 N Blaze Trail Unit 37
- 40324 N Blaze Trail
- 2234 W Webster Ct Unit 23
- 40416 N Blaze Trail
- 40413 N Copper Basin Trail Unit 23
- 40318 N Blaze Trail
- 40511 N Copper Basin Trail
- 40422 N Blaze Trail Unit 37
- 40537 N Travis Trail
- 40426 N Copper Basin Trail