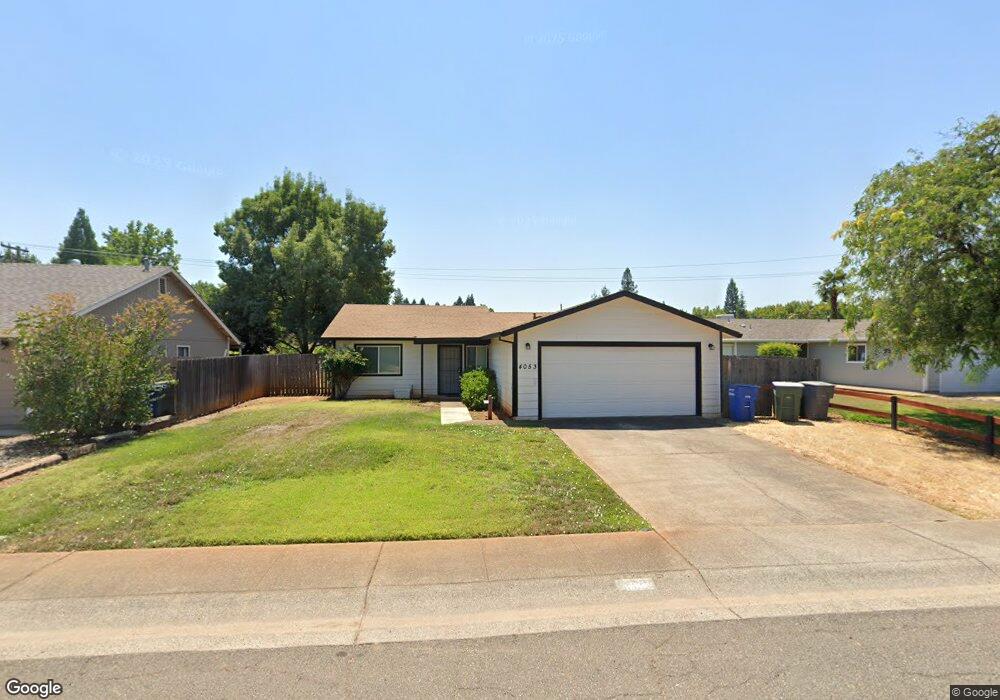
4053 Cirrus St Redding, CA 96002
Starview NeighborhoodEstimated Value: $279,000 - $326,000
3
Beds
2
Baths
990
Sq Ft
$302/Sq Ft
Est. Value
About This Home
This home is located at 4053 Cirrus St, Redding, CA 96002 and is currently estimated at $298,509, approximately $301 per square foot. 4053 Cirrus St is a home located in Shasta County with nearby schools including Alta Mesa Elementary School, Parsons Junior High School, and Enterprise High School.
Ownership History
Date
Name
Owned For
Owner Type
Purchase Details
Closed on
Apr 9, 2020
Sold by
Thomas Leland S and Thomas Sandra Y
Bought by
Propert T Llc
Current Estimated Value
Purchase Details
Closed on
May 31, 2018
Sold by
Richards Laura
Bought by
Thomas Leland S and Thomas Sandra Y
Purchase Details
Closed on
Mar 1, 2018
Sold by
Richards Laura
Bought by
Richards Laura
Purchase Details
Closed on
Jul 15, 2008
Sold by
Va
Bought by
Richards Patrick G and Easterla Laura Ann
Create a Home Valuation Report for This Property
The Home Valuation Report is an in-depth analysis detailing your home's value as well as a comparison with similar homes in the area
Home Values in the Area
Average Home Value in this Area
Purchase History
| Date | Buyer | Sale Price | Title Company |
|---|---|---|---|
| Propert T Llc | -- | None Available | |
| Thomas Leland S | $125,000 | Placer Title Co | |
| Richards Laura | -- | None Available | |
| Richards Patrick G | -- | None Available |
Source: Public Records
Tax History
| Year | Tax Paid | Tax Assessment Tax Assessment Total Assessment is a certain percentage of the fair market value that is determined by local assessors to be the total taxable value of land and additions on the property. | Land | Improvement |
|---|---|---|---|---|
| 2025 | $2,446 | $224,193 | $49,212 | $174,981 |
| 2024 | $2,412 | $219,798 | $48,248 | $171,550 |
| 2023 | $2,412 | $215,489 | $47,302 | $168,187 |
| 2022 | $2,344 | $211,265 | $46,375 | $164,890 |
| 2021 | $2,264 | $207,123 | $45,466 | $161,657 |
| 2020 | $1,725 | $156,060 | $41,616 | $114,444 |
| 2019 | $1,711 | $153,000 | $40,800 | $112,200 |
| 2018 | $1,127 | $98,921 | $29,672 | $69,249 |
| 2017 | $1,088 | $98,921 | $29,672 | $69,249 |
| 2016 | $1,017 | $96,983 | $29,091 | $67,892 |
| 2015 | $1,008 | $95,528 | $28,655 | $66,873 |
| 2014 | $999 | $93,658 | $28,094 | $65,564 |
Source: Public Records
Map
Nearby Homes
- 2068 Solar Way
- 2332 Venus Way
- 3466 Silverwood St
- 1513 Harpole Rd
- 3425 Silverwood St
- 2427 Castlewood Dr
- 3688 Polaris Way
- 3341 Timbercreek Dr
- 4624 Columbine Dr
- 2366 Templeton Dr
- 3361 Alta Mesa Dr
- 4302 Paulson Ln
- 3733 Capricorn Way
- 2498 Saturn Skyway
- 3703 Harrow Ct
- 2354 Suzette Ave
- 4646 Alta Camino Dr
- 3512 Capricorn Way
- 2704 Western Oak Dr
- 2364 La Madre Ct
- 4061 Cirrus St
- 4045 Cirrus St
- 1904 Jeanae Ct
- 1904 Jeanae Court#25 Unit 25
- 4037 Cirrus St
- 1918 Jeanae Ct
- 4075 Cirrus St
- 4068 Cirrus St
- 1932 Jeanae Ct
- 1900 Jeanae Ct
- 4104 Cirrus St
- 4029 Cirrus St
- 4044 Cirrus St Unit 1
- 4044 Cirrus St
- 4116 Cirrus St
- 4032 Cirrus St
- 1946 Jeanae Ct Unit 1
- 4143 Cirrus St
- 4128 Cirrus St
- 4017 Cirrus St
Your Personal Tour Guide
Ask me questions while you tour the home.