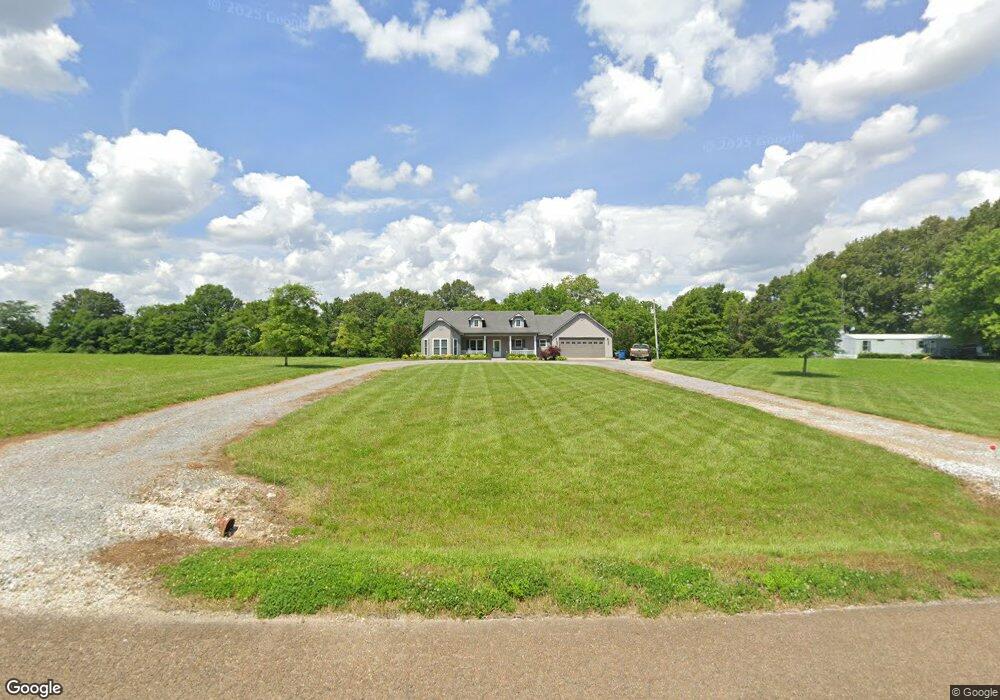
4053 N Grace Roach Rd South Fulton, TN 38257
Estimated Value: $255,000 - $301,000
3
Beds
2
Baths
1,652
Sq Ft
$173/Sq Ft
Est. Value
About This Home
This home is located at 4053 N Grace Roach Rd, South Fulton, TN 38257 and is currently estimated at $285,310, approximately $172 per square foot. 4053 N Grace Roach Rd is a home.
Ownership History
Date
Name
Owned For
Owner Type
Purchase Details
Closed on
Jun 16, 2012
Sold by
Eastep Johnny
Bought by
Eastep Johnny and Brundige Connie
Current Estimated Value
Purchase Details
Closed on
Jul 30, 2010
Sold by
Alley Sheree
Bought by
Alley Sheree
Purchase Details
Closed on
Sep 20, 1991
Bought by
Eastep Bonnie Ruth Roach
Create a Home Valuation Report for This Property
The Home Valuation Report is an in-depth analysis detailing your home's value as well as a comparison with similar homes in the area
Home Values in the Area
Average Home Value in this Area
Purchase History
| Date | Buyer | Sale Price | Title Company |
|---|---|---|---|
| Eastep Johnny | -- | -- | |
| Alley Sheree | -- | -- | |
| Eastep Bonnie Ruth Roach | -- | -- |
Source: Public Records
Tax History Compared to Growth
Tax History
| Year | Tax Paid | Tax Assessment Tax Assessment Total Assessment is a certain percentage of the fair market value that is determined by local assessors to be the total taxable value of land and additions on the property. | Land | Improvement |
|---|---|---|---|---|
| 2024 | $891 | $64,575 | $5,950 | $58,625 |
| 2023 | $894 | $64,775 | $5,950 | $58,825 |
| 2022 | $793 | $41,750 | $5,275 | $36,475 |
| 2021 | $793 | $41,750 | $5,275 | $36,475 |
| 2020 | $793 | $41,750 | $5,275 | $36,475 |
| 2019 | $793 | $41,750 | $5,275 | $36,475 |
| 2018 | $790 | $41,750 | $5,275 | $36,475 |
| 2017 | $821 | $40,975 | $5,275 | $35,700 |
| 2016 | $821 | $40,975 | $5,275 | $35,700 |
| 2015 | $821 | $40,975 | $5,275 | $35,700 |
| 2014 | $122 | $6,100 | $5,275 | $825 |
Source: Public Records
Map
Nearby Homes
- 5024 Old Pierce Rd
- 4988 Milltown Rd
- 508 Vancil St
- 507 Vancil St
- 216 Old Pierce Rd
- 210 Old Pierce Rd
- 811 Key St
- 413 Honey Locust Dr
- 1633 Spruce Ave
- 709 Tennessee St
- 1743 Beechwood St
- 109 West St
- 1015 W 4th St
- 1008 W 4th St
- 104 Park Ave Unit F
- 608 Green St
- 310 2nd St Unit F
- 1109 W 5th St
- 204 Park St
- 304 Eddings St
- 4100 N Grace Roach Rd
- 4143 N Grace Roach Rd
- 3985 N Grace Roach Rd
- 4178 N Grace Roach Rd
- 4160 Smith Cardwell Rd
- 3920 N Grace Roach Rd
- 4045 Smith Cardwell Rd
- 4151 Smith Cardwell Rd
- 7786 E Pierce Station Rd
- 7995 E Pierce Station Rd
- 4137 John Ferguson Rd
- 3955 Smith Cardwell Rd
- 3898 Smith Cardwell Rd
- 7947 E Pierce Station Rd
- 4199 John Ferguson Rd
- 4160 John Ferguson Rd
- 4255 John Ferguson Rd
- 3850 Old Love Rd
- 4192 John Ferguson Rd
- 7973 E Pierce Station Rd