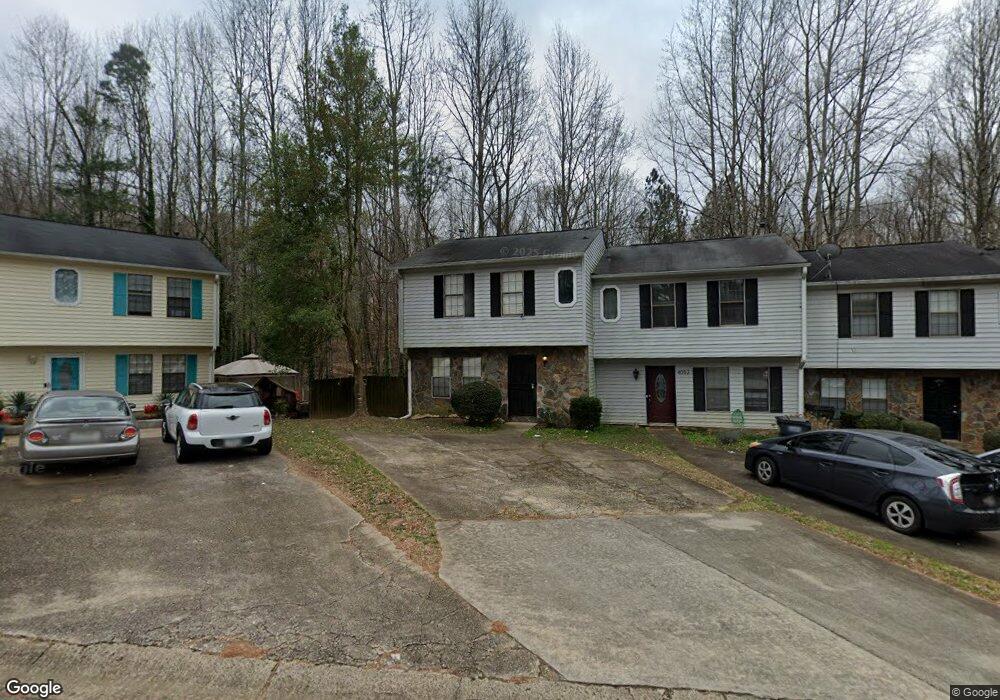
4054 Laurie jo Dr SW Marietta, GA 30008
Estimated Value: $186,000 - $209,000
2
Beds
3
Baths
1,276
Sq Ft
$157/Sq Ft
Est. Value
About This Home
This home is located at 4054 Laurie jo Dr SW, Marietta, GA 30008 and is currently estimated at $199,723, approximately $156 per square foot. 4054 Laurie jo Dr SW is a home located in Cobb County with nearby schools including Sanders Elementary School, Garrett Middle School, and South Cobb High School.
Ownership History
Date
Name
Owned For
Owner Type
Purchase Details
Closed on
Jun 19, 2008
Sold by
Woghiren Kings
Bought by
Perkins Felicia A
Current Estimated Value
Home Financials for this Owner
Home Financials are based on the most recent Mortgage that was taken out on this home.
Original Mortgage
$76,982
Outstanding Balance
$48,981
Interest Rate
5.97%
Mortgage Type
FHA
Estimated Equity
$150,742
Purchase Details
Closed on
Aug 31, 2001
Sold by
Wilger Donald C and Wilger Trenna J
Bought by
Woghiren Kings
Home Financials for this Owner
Home Financials are based on the most recent Mortgage that was taken out on this home.
Original Mortgage
$82,106
Interest Rate
6.98%
Mortgage Type
FHA
Purchase Details
Closed on
Dec 1, 1994
Sold by
Garrett Cindy D
Bought by
Wilger Donald C Trenna J
Home Financials for this Owner
Home Financials are based on the most recent Mortgage that was taken out on this home.
Original Mortgage
$45,041
Interest Rate
9.01%
Mortgage Type
FHA
Create a Home Valuation Report for This Property
The Home Valuation Report is an in-depth analysis detailing your home's value as well as a comparison with similar homes in the area
Home Values in the Area
Average Home Value in this Area
Purchase History
| Date | Buyer | Sale Price | Title Company |
|---|---|---|---|
| Perkins Felicia A | $77,600 | -- | |
| Woghiren Kings | $83,400 | -- | |
| Wilger Donald C Trenna J | $45,000 | -- |
Source: Public Records
Mortgage History
| Date | Status | Borrower | Loan Amount |
|---|---|---|---|
| Open | Perkins Felicia A | $76,982 | |
| Previous Owner | Woghiren Kings | $82,106 | |
| Previous Owner | Wilger Donald C Trenna J | $45,041 |
Source: Public Records
Tax History Compared to Growth
Tax History
| Year | Tax Paid | Tax Assessment Tax Assessment Total Assessment is a certain percentage of the fair market value that is determined by local assessors to be the total taxable value of land and additions on the property. | Land | Improvement |
|---|---|---|---|---|
| 2025 | $2,307 | $76,580 | $18,000 | $58,580 |
| 2024 | $2,309 | $76,580 | $18,000 | $58,580 |
| 2023 | $1,887 | $62,596 | $8,000 | $54,596 |
| 2022 | $1,900 | $62,596 | $8,000 | $54,596 |
| 2021 | $1,222 | $40,260 | $8,000 | $32,260 |
| 2020 | $976 | $32,172 | $8,000 | $24,172 |
| 2019 | $824 | $27,144 | $6,800 | $20,344 |
| 2018 | $824 | $27,144 | $6,800 | $20,344 |
| 2017 | $700 | $24,364 | $10,800 | $13,564 |
| 2016 | $585 | $20,364 | $6,800 | $13,564 |
| 2015 | $284 | $18,468 | $6,000 | $12,468 |
| 2014 | $137 | $13,428 | $0 | $0 |
Source: Public Records
Map
Nearby Homes
- Reynolds Plan at Hampton Trace
- Forsyth Plan at Hampton Trace
- 1570 Halbrook Place SW
- 3661 Willingham Run SW
- 1763 Merry Oak Rd SW
- 3722 Willingham Run SW
- 3726 Willingham Run SW
- 3730 Willingham Run SW
- 3559 Ashley Station Dr SW
- 1688 Lansmere St SW
- 1745 Lansmere St SW
- 1713 Lansmere St SW
- 1717 Lansmere St SW
- 1701 Lansmere St SW
- 3580 Main Station Dr SW
- 1693 Lansmere St SW
- 1689 Lansmere St SW
- 1539 Rockingway Dr SW
- 1810 Killarney Dr SW
- 3517 Greenway Dr SW
- 4054 Laurie jo Dr SW
- 4052 Laurie jo Dr SW
- 4050 Laurie jo Dr SW
- 4050 Laurie jo Dr SW Unit 4050
- 4056 Laurie jo Dr SW
- 4048 Laurie jo Dr SW
- 4058 Laurie jo Dr SW
- 4058 Laurie jo Dr SW Unit 4058
- 4060 Laurie jo Dr SW
- 4046 Laurie jo Dr SW Unit 8
- 4046 Laurie jo Dr SW
- 4046 Laurie jo Dr SW
- 4062 Laurie jo Dr SW
- 4062 Laurie jo Dr SW Unit 2
- 4044 Laurie jo Dr SW
- 4035 Laurie jo Dr SW
- 4047 Laurie jo Dr SW
- 4047 Laurie jo Dr SW Unit 17
- 4045 Laurie jo Dr SW Unit II
- 4042 Laurie jo Dr SW