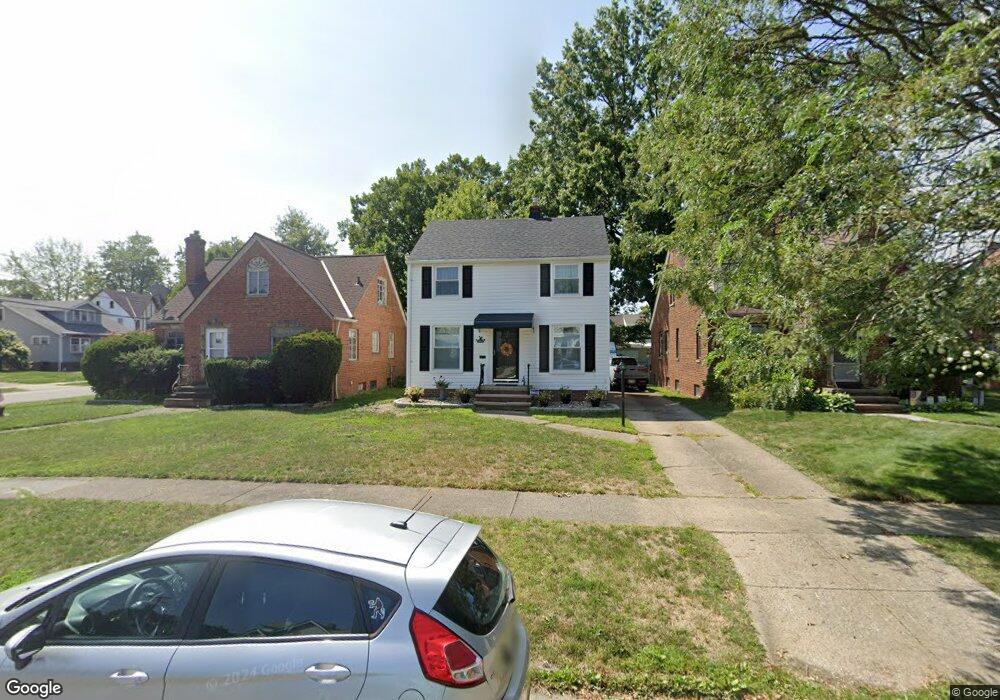
4054 W 163rd St Cleveland, OH 44135
Kamm's Corners NeighborhoodEstimated Value: $196,590 - $240,000
3
Beds
1
Bath
1,056
Sq Ft
$206/Sq Ft
Est. Value
About This Home
This home is located at 4054 W 163rd St, Cleveland, OH 44135 and is currently estimated at $217,648, approximately $206 per square foot. 4054 W 163rd St is a home located in Cuyahoga County with nearby schools including Artemus Ward School, Almira Academy, and Benjamin Franklin.
Ownership History
Date
Name
Owned For
Owner Type
Purchase Details
Closed on
Apr 26, 2022
Sold by
Joy Trimmer Rosemary
Bought by
Trimmer Michael S and Trimmer Rosemary Joy
Current Estimated Value
Purchase Details
Closed on
Oct 13, 1999
Sold by
Fuchs Yvette D and Forcht Joseph G
Bought by
Hayes Rosemary Joy
Home Financials for this Owner
Home Financials are based on the most recent Mortgage that was taken out on this home.
Original Mortgage
$108,770
Interest Rate
7.9%
Mortgage Type
FHA
Purchase Details
Closed on
Jan 29, 1997
Sold by
Fuchs Siegmund
Bought by
Forcht Joseph G and Fuchs Yvette D
Home Financials for this Owner
Home Financials are based on the most recent Mortgage that was taken out on this home.
Original Mortgage
$76,500
Interest Rate
7.29%
Mortgage Type
New Conventional
Purchase Details
Closed on
Jan 1, 1975
Bought by
Fuchs Siegmund and Fuchs Denise M
Create a Home Valuation Report for This Property
The Home Valuation Report is an in-depth analysis detailing your home's value as well as a comparison with similar homes in the area
Home Values in the Area
Average Home Value in this Area
Purchase History
| Date | Buyer | Sale Price | Title Company |
|---|---|---|---|
| Trimmer Michael S | -- | Doian Law Firm Llc | |
| Hayes Rosemary Joy | $112,900 | Midland Title Security Inc | |
| Forcht Joseph G | $90,000 | -- | |
| Fuchs Siegmund | -- | -- |
Source: Public Records
Mortgage History
| Date | Status | Borrower | Loan Amount |
|---|---|---|---|
| Previous Owner | Hayes Rosemary Joy | $108,770 | |
| Previous Owner | Forcht Joseph G | $76,500 |
Source: Public Records
Tax History Compared to Growth
Tax History
| Year | Tax Paid | Tax Assessment Tax Assessment Total Assessment is a certain percentage of the fair market value that is determined by local assessors to be the total taxable value of land and additions on the property. | Land | Improvement |
|---|---|---|---|---|
| 2024 | $3,970 | $60,550 | $13,545 | $47,005 |
| 2023 | $3,205 | $42,250 | $10,960 | $31,290 |
| 2022 | $3,186 | $42,250 | $10,960 | $31,290 |
| 2021 | $3,154 | $42,250 | $10,960 | $31,290 |
| 2020 | $2,808 | $32,520 | $8,440 | $24,080 |
| 2019 | $2,597 | $92,900 | $24,100 | $68,800 |
| 2018 | $2,588 | $32,520 | $8,440 | $24,080 |
| 2017 | $2,580 | $31,290 | $7,420 | $23,870 |
| 2016 | $2,560 | $31,290 | $7,420 | $23,870 |
| 2015 | $2,337 | $31,290 | $7,420 | $23,870 |
| 2014 | $2,337 | $28,460 | $6,760 | $21,700 |
Source: Public Records
Map
Nearby Homes
- 4096 W 161st St
- 15804 Chatfield Ave
- 3942 W 160th St
- 4049 W 157th St
- 3918 W 160th St
- 17202 Melgrave Ave
- 16717 Valleyview Ave
- 4267 W 162nd St
- 17301 Bradgate Ave
- 17705 Susan Ave
- 17706 Susan Ave
- 16701 Elsienna Ave
- 16312 Laverne Ave
- 17408 Elsienna Ave
- 3726 W 169th St
- 17517 Oxford Ave
- 15617 Leigh Ellen Ave
- 4413 W 173rd St
- 15617 Mina Ave
- 4321 W 181st St
- 4050 W 163rd St
- 4058 W 163rd St
- 4046 W 163rd St
- 4042 W 163rd St
- 4055 W 166th St
- 4051 W 166th St
- 4059 W 166th St
- 4038 W 163rd St
- 4047 W 166th St
- 16401 Larchwood Ave
- 16405 Larchwood Ave
- 4043 W 166th St
- 16501 Larchwood Ave
- 16213 Larchwood Ave
- 4034 W 163rd St
- 16505 Larchwood Ave
- 4051 W 163rd St
- 4059 W 163rd St
- 4039 W 166th St
- 4047 W 163rd St