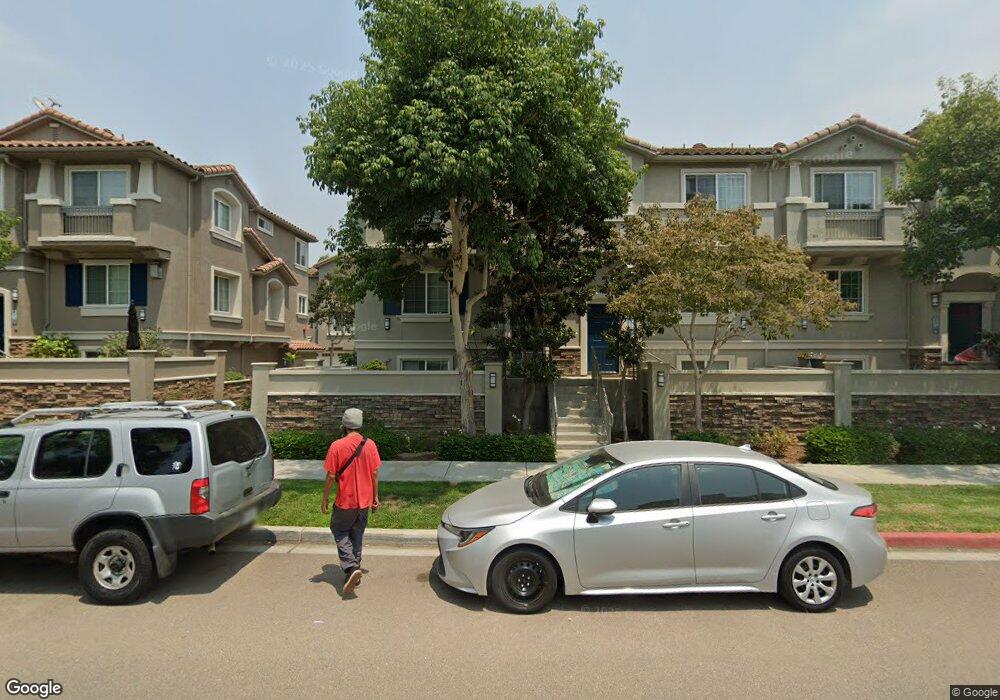
4055 Aidan Cir Carlsbad, CA 92008
Hedionda Point NeighborhoodEstimated Value: $1,140,381 - $1,313,000
4
Beds
3
Baths
1,842
Sq Ft
$669/Sq Ft
Est. Value
About This Home
This home is located at 4055 Aidan Cir, Carlsbad, CA 92008 and is currently estimated at $1,231,845, approximately $668 per square foot. 4055 Aidan Cir is a home located in San Diego County with nearby schools including Magnolia Elementary, Carlsbad High School, and Sage Creek High.
Ownership History
Date
Name
Owned For
Owner Type
Purchase Details
Closed on
Oct 15, 2019
Sold by
Smith Matthew
Bought by
Hermansen Jessica A
Current Estimated Value
Home Financials for this Owner
Home Financials are based on the most recent Mortgage that was taken out on this home.
Original Mortgage
$400,000
Outstanding Balance
$349,699
Interest Rate
3.4%
Mortgage Type
New Conventional
Estimated Equity
$882,146
Purchase Details
Closed on
Oct 11, 2019
Sold by
Hermansen Jessica A
Bought by
Hermansen Jessica A
Home Financials for this Owner
Home Financials are based on the most recent Mortgage that was taken out on this home.
Original Mortgage
$400,000
Outstanding Balance
$349,699
Interest Rate
3.4%
Mortgage Type
New Conventional
Estimated Equity
$882,146
Purchase Details
Closed on
Dec 10, 2008
Sold by
Anastasi Development Company Llc
Bought by
Hermansen Jessica A
Home Financials for this Owner
Home Financials are based on the most recent Mortgage that was taken out on this home.
Original Mortgage
$485,347
Interest Rate
4.92%
Mortgage Type
FHA
Create a Home Valuation Report for This Property
The Home Valuation Report is an in-depth analysis detailing your home's value as well as a comparison with similar homes in the area
Home Values in the Area
Average Home Value in this Area
Purchase History
| Date | Buyer | Sale Price | Title Company |
|---|---|---|---|
| Hermansen Jessica A | -- | Fidelity National Title | |
| Hermansen Jessica A | -- | Fidelity National Title | |
| Hermansen Jessica A | $530,000 | Lawyers Title |
Source: Public Records
Mortgage History
| Date | Status | Borrower | Loan Amount |
|---|---|---|---|
| Open | Hermansen Jessica A | $400,000 | |
| Previous Owner | Hermansen Jessica A | $485,347 |
Source: Public Records
Tax History Compared to Growth
Tax History
| Year | Tax Paid | Tax Assessment Tax Assessment Total Assessment is a certain percentage of the fair market value that is determined by local assessors to be the total taxable value of land and additions on the property. | Land | Improvement |
|---|---|---|---|---|
| 2025 | $7,149 | $682,500 | $315,437 | $367,063 |
| 2024 | $7,149 | $669,118 | $309,252 | $359,866 |
| 2023 | $7,113 | $655,999 | $303,189 | $352,810 |
| 2022 | $7,003 | $643,138 | $297,245 | $345,893 |
| 2021 | $6,951 | $630,528 | $291,417 | $339,111 |
| 2020 | $6,904 | $624,063 | $288,429 | $335,634 |
| 2019 | $6,702 | $611,827 | $282,774 | $329,053 |
| 2018 | $6,417 | $599,831 | $277,230 | $322,601 |
| 2017 | $6,309 | $588,071 | $271,795 | $316,276 |
| 2016 | $6,053 | $576,541 | $266,466 | $310,075 |
| 2015 | $6,028 | $567,882 | $262,464 | $305,418 |
| 2014 | $5,926 | $556,759 | $257,323 | $299,436 |
Source: Public Records
Map
Nearby Homes
- 4031 Aidan Cir Unit 1205
- 4007 Bluff View Way
- 1120 Cape Aire Ln
- 1095 Hoover St
- 0 Hoover St
- 4020 Layang Cir Unit C
- 817 Kalpati Cir Unit 212
- 801 Kalpati Cir Unit B
- 3975 Stella Maris Ln
- 1199 Tamarack Ave
- 4009 Canario St Unit H
- 4007 Canario St Unit E
- 4000 James Dr
- 3747-51 Adams St Plan at Adam Street Homes - Adams Street Homes
- 3755-59 Adams St Plan at Adam Street Homes - Adams Street Homes
- 3731-35 Adams St Plan at Adam Street Homes - Adams Street Homes
- 3739-43 Adams St Plan at Adam Street Homes - Adams Street Homes
- 3755 Adams St
- 0 Adams St Unit OC24201399
- 334 Date Ave
- 4053 Aidan Cir
- 4049 Aidan Cir Unit 1003
- 4047 Aidan Cir Unit 1002
- 1024 Point Way Unit 901
- 4061 Aidan Cir
- 4045 Aidan Cir
- 1026 Point Way
- 4059 Aidan Cir
- 4063 Aidan Cir
- 1028 Point Way Unit 903
- 4113 Harrison St
- 1032 Point Way
- 4041 Aidan Cir Unit 1104
- 4039 Aidan Cir Unit 1103
- 4123 Harrison St
- 4038 Aidan Cir
- 4065 Aidan Cir
- 4036 Aidan Cir
- 4113-15 Harrison St
- 4037 Aidan Cir