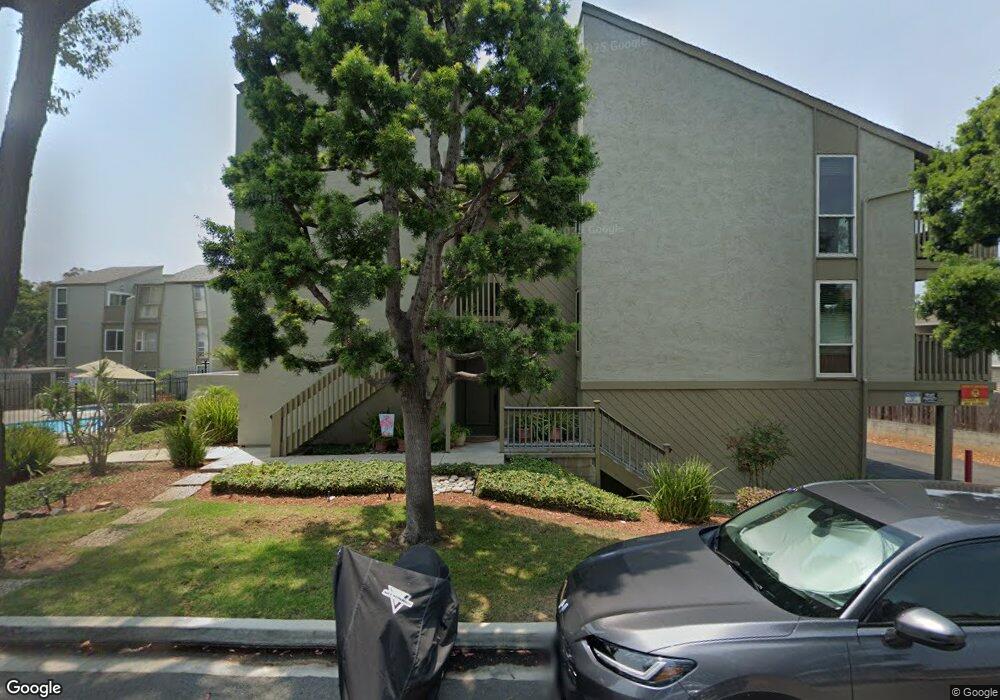
4055 Harrison St Unit 3 Carlsbad, CA 92008
Hedionda Point NeighborhoodEstimated Value: $687,734 - $889,000
2
Beds
2
Baths
1,030
Sq Ft
$760/Sq Ft
Est. Value
About This Home
This home is located at 4055 Harrison St Unit 3, Carlsbad, CA 92008 and is currently estimated at $782,934, approximately $760 per square foot. 4055 Harrison St Unit 3 is a home located in San Diego County with nearby schools including Magnolia Elementary, Carlsbad High School, and Sage Creek High.
Ownership History
Date
Name
Owned For
Owner Type
Purchase Details
Closed on
Nov 5, 2009
Sold by
Plumlee Donna
Bought by
Black Plumlee Donna
Current Estimated Value
Purchase Details
Closed on
Mar 13, 2000
Sold by
Swjt Mccoy Kandi and Swjt Thompson K
Bought by
Plumlee Donna
Purchase Details
Closed on
May 14, 1998
Sold by
Freatman Clark
Bought by
Mccoy Kandi
Home Financials for this Owner
Home Financials are based on the most recent Mortgage that was taken out on this home.
Original Mortgage
$96,000
Interest Rate
6.75%
Purchase Details
Closed on
Apr 17, 1998
Sold by
Fitzgerald James W
Bought by
Mccoy Kandi
Home Financials for this Owner
Home Financials are based on the most recent Mortgage that was taken out on this home.
Original Mortgage
$96,000
Interest Rate
6.75%
Purchase Details
Closed on
Apr 10, 1993
Sold by
Vogel Fred R
Bought by
Fitzgerald James W
Purchase Details
Closed on
Feb 1, 1989
Purchase Details
Closed on
Aug 6, 1986
Create a Home Valuation Report for This Property
The Home Valuation Report is an in-depth analysis detailing your home's value as well as a comparison with similar homes in the area
Home Values in the Area
Average Home Value in this Area
Purchase History
We collect this data history from publicly available records. To have your information removed, we recommend requesting removal directly through your county’s website.
| Date | Buyer | Sale Price | Title Company |
|---|---|---|---|
| Black Plumlee Donna | -- | None Available | |
| Plumlee Donna | $148,000 | Chicago Title Co | |
| Mccoy Kandi | -- | Southland Title | |
| Mccoy Kandi | $120,000 | Southland Title | |
| Fitzgerald James W | -- | -- | |
| -- | $89,000 | -- | |
| -- | $65,000 | -- |
Source: Public Records
Mortgage History
We collect this data history from publicly available records. To have your information removed, we recommend requesting removal directly through your county’s website.
| Date | Status | Borrower | Loan Amount |
|---|---|---|---|
| Previous Owner | Mccoy Kandi | $96,000 |
Source: Public Records
Tax History
| Year | Tax Paid | Tax Assessment Tax Assessment Total Assessment is a certain percentage of the fair market value that is determined by local assessors to be the total taxable value of land and additions on the property. | Land | Improvement |
|---|---|---|---|---|
| 2025 | $2,346 | $227,443 | $90,973 | $136,470 |
| 2024 | $2,346 | $222,985 | $89,190 | $133,795 |
| 2023 | $2,332 | $218,614 | $87,442 | $131,172 |
| 2022 | $2,294 | $214,328 | $85,728 | $128,600 |
| 2021 | $2,276 | $210,127 | $84,048 | $126,079 |
| 2020 | $2,260 | $207,974 | $83,187 | $124,787 |
| 2019 | $2,218 | $203,897 | $81,556 | $122,341 |
| 2018 | $2,124 | $199,900 | $79,957 | $119,943 |
| 2017 | $2,088 | $195,982 | $78,390 | $117,592 |
| 2016 | $2,003 | $192,140 | $76,853 | $115,287 |
| 2015 | $1,980 | $189,255 | $75,699 | $113,556 |
| 2014 | $1,946 | $185,549 | $74,217 | $111,332 |
Source: Public Records
Map
Nearby Homes
- 4009 Layang Cir Unit J
- 832 Kalpati Cir Unit E
- 4011 Layang Cir Unit F
- 4235 Harrison St
- 4020 Layang Cir Unit C
- 823 Kalpati Cir Unit 101
- 4332 Adams St
- 4340 Adams St
- 809 Kalpati Cir Unit 321
- 4301 & 4311 Brooks Way
- 4030 Syme Dr
- 1095 Hoover St
- 0 Hoover St
- 1115 Hoover St
- 3880 Adams St
- 3945 Hibiscus Cir
- 4350 Highland Dr
- 707 Magnolia Ave
- 4208 Park Dr
- 722 30 Magnolia Magnolia Ave
- 4055 Harrison St Unit 1
- 4055 Harrison St Unit 2
- 4055 Harrison St Unit 4
- 4075 Harrison St Unit 3
- 4075 Harrison St Unit 4
- 4075 Harrison St Unit 1
- 4075 Harrison St Unit 2
- 4065 Harrison St Unit 3
- 4065 Harrison St Unit 4
- 4065 Harrison St Unit 1
- 4065 Harrison St Unit 2
- 4025 Aidan Cir
- 4027 Aidan Cir
- 4023 Aidan Cir Unit 1201
- 4029 Aidan Cir
- 4029 Aidan Cir
- 4035 Aidan Cir
- 4095 Harrison St Unit 2
- 4095 Harrison St Unit 3
- 4095 Harrison St Unit 4
Your Personal Tour Guide
Ask me questions while you tour the home.