Estimated Value: $407,000 - $430,000
3
Beds
2
Baths
1,228
Sq Ft
$340/Sq Ft
Est. Value
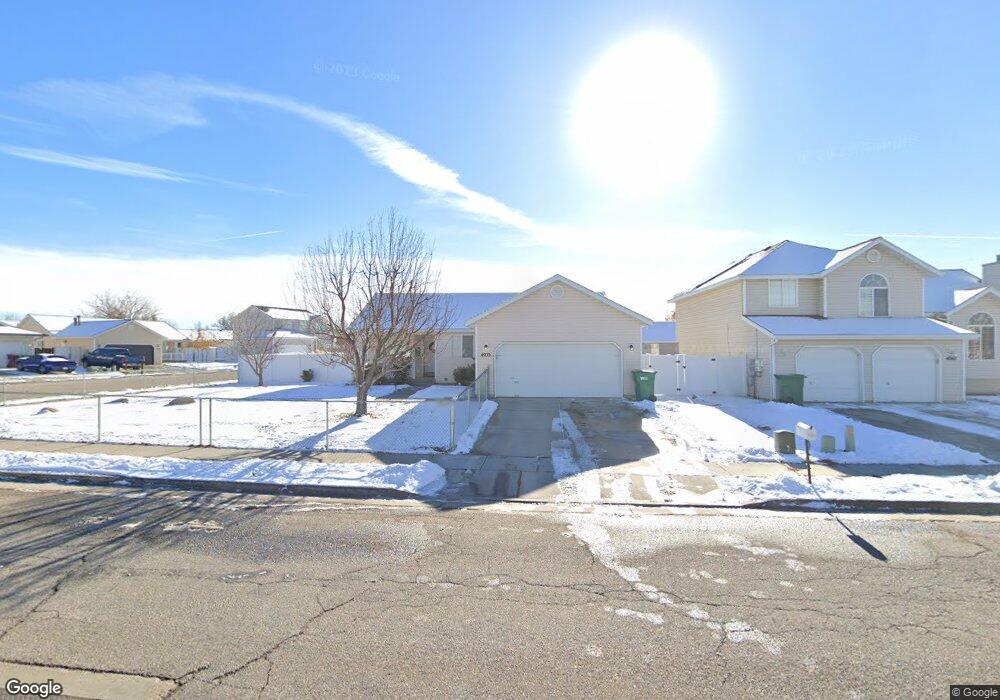
About This Home
This home is located at 4055 W 5250 S, Roy, UT 84067 and is currently estimated at $416,911, approximately $339 per square foot. 4055 W 5250 S is a home located in Weber County with nearby schools including Freedom School, Roy Junior High School, and Roy High School.
Ownership History
Date
Name
Owned For
Owner Type
Purchase Details
Closed on
Jun 18, 2021
Sold by
Ly Minh
Bought by
Authentic Residential Llc
Current Estimated Value
Purchase Details
Closed on
Mar 28, 2011
Sold by
Russell James and Russell Sonje
Bought by
Ly Minh
Home Financials for this Owner
Home Financials are based on the most recent Mortgage that was taken out on this home.
Original Mortgage
$96,000
Interest Rate
4.9%
Mortgage Type
New Conventional
Purchase Details
Closed on
Aug 19, 2004
Sold by
Chadwick Charles V and Chadwick Stephanie J
Bought by
Russell James and Russell Sonje
Purchase Details
Closed on
Aug 6, 1999
Sold by
Alpine Homes Inc
Bought by
Chadwick Charles and Chadwick Stephanie J
Home Financials for this Owner
Home Financials are based on the most recent Mortgage that was taken out on this home.
Original Mortgage
$100,652
Interest Rate
7.64%
Create a Home Valuation Report for This Property
The Home Valuation Report is an in-depth analysis detailing your home's value as well as a comparison with similar homes in the area
Home Values in the Area
Average Home Value in this Area
Purchase History
| Date | Buyer | Sale Price | Title Company |
|---|---|---|---|
| Authentic Residential Llc | -- | Hickman Land Title Layton | |
| Ly Minh | -- | First American Layton | |
| Russell James | -- | Associated Title Insurance A | |
| Chadwick Charles | -- | First American Title |
Source: Public Records
Mortgage History
| Date | Status | Borrower | Loan Amount |
|---|---|---|---|
| Previous Owner | Ly Minh | $96,000 | |
| Previous Owner | Chadwick Charles | $100,652 |
Source: Public Records
Tax History Compared to Growth
Tax History
| Year | Tax Paid | Tax Assessment Tax Assessment Total Assessment is a certain percentage of the fair market value that is determined by local assessors to be the total taxable value of land and additions on the property. | Land | Improvement |
|---|---|---|---|---|
| 2025 | $2,541 | $401,437 | $130,241 | $271,196 |
| 2024 | $2,459 | $391,000 | $130,241 | $260,759 |
| 2023 | $2,470 | $395,000 | $122,102 | $272,898 |
| 2022 | $2,545 | $420,000 | $108,169 | $311,831 |
| 2021 | $1,992 | $295,000 | $82,313 | $212,687 |
| 2020 | $1,921 | $262,000 | $82,313 | $179,687 |
| 2019 | $1,813 | $232,000 | $46,848 | $185,152 |
| 2018 | $1,736 | $209,000 | $43,900 | $165,100 |
| 2017 | $1,604 | $180,000 | $43,900 | $136,100 |
| 2016 | $1,537 | $92,673 | $22,658 | $70,015 |
| 2015 | $1,371 | $83,898 | $22,658 | $61,240 |
| 2014 | $1,304 | $78,391 | $19,913 | $58,478 |
Source: Public Records
Map
Nearby Homes
- 4055 W 5250 S Unit 45
- 4067 W 5250 S
- 4032 W 5250 S
- 4048 W 5300 S
- 4087 W 5250 S
- 4042 W 5300 S
- 4042 W 5300 S Unit 44
- 4064 W 5250 S
- 4064 W 5250 S Unit 23
- 4028 W 5300 S
- 4028 W 5300 S Unit 43
- 4052 W 5250 S
- 4052 W 5250 S Unit 24
- 4066 W 5300 S
- 4070 W 5250 S
- 4045 W 5300 S
- 4038 W 5250 S
- 4038 W 5250 S Unit 25
- 5302 S 4050 W
- 4086 W 5250 S