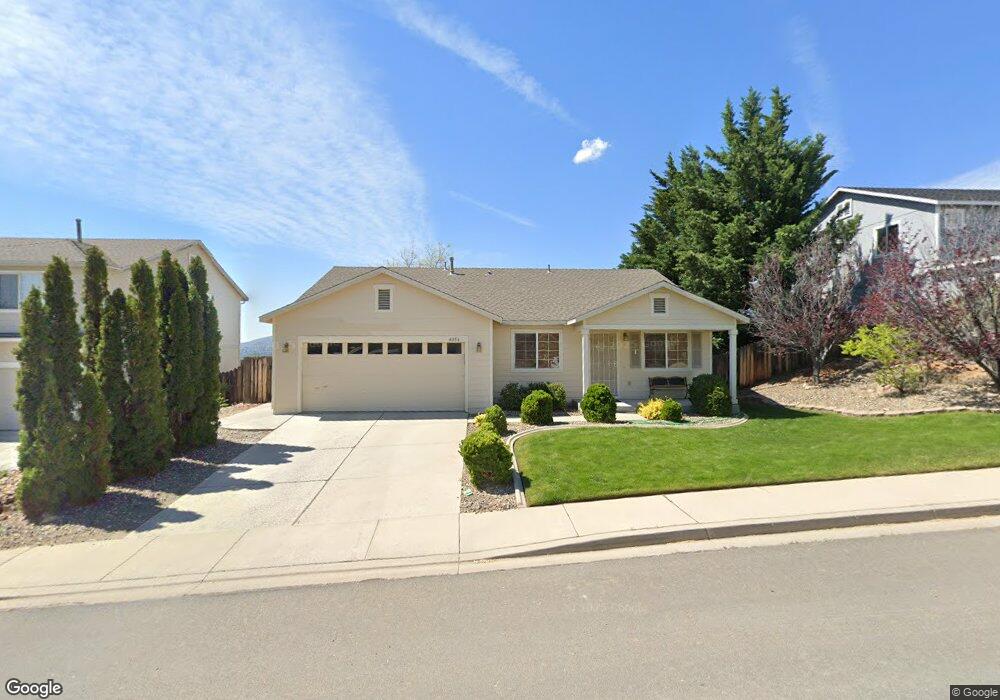
4056 Kings Row Reno, NV 89503
Kings Row NeighborhoodEstimated Value: $527,046 - $604,000
3
Beds
2
Baths
1,494
Sq Ft
$382/Sq Ft
Est. Value
About This Home
This home is located at 4056 Kings Row, Reno, NV 89503 and is currently estimated at $570,512, approximately $381 per square foot. 4056 Kings Row is a home located in Washoe County with nearby schools including Mamie Towles Elementary School, Archie Clayton Pre-AP Academy, and Robert McQueen High School.
Ownership History
Date
Name
Owned For
Owner Type
Purchase Details
Closed on
Mar 1, 2000
Sold by
Centex Homes
Bought by
Mierau Marcus Scott
Current Estimated Value
Home Financials for this Owner
Home Financials are based on the most recent Mortgage that was taken out on this home.
Original Mortgage
$129,700
Outstanding Balance
$43,039
Interest Rate
8%
Estimated Equity
$527,473
Create a Home Valuation Report for This Property
The Home Valuation Report is an in-depth analysis detailing your home's value as well as a comparison with similar homes in the area
Home Values in the Area
Average Home Value in this Area
Purchase History
| Date | Buyer | Sale Price | Title Company |
|---|---|---|---|
| Mierau Marcus Scott | $164,000 | First Centennial Title Co |
Source: Public Records
Mortgage History
| Date | Status | Borrower | Loan Amount |
|---|---|---|---|
| Open | Mierau Marcus Scott | $129,700 | |
| Closed | Mierau Marcus Scott | $24,300 |
Source: Public Records
Tax History Compared to Growth
Tax History
| Year | Tax Paid | Tax Assessment Tax Assessment Total Assessment is a certain percentage of the fair market value that is determined by local assessors to be the total taxable value of land and additions on the property. | Land | Improvement |
|---|---|---|---|---|
| 2025 | $2,652 | $101,792 | $44,835 | $56,957 |
| 2024 | $2,652 | $95,924 | $38,500 | $57,424 |
| 2023 | $1,869 | $94,927 | $40,495 | $54,432 |
| 2022 | $2,501 | $78,124 | $32,760 | $45,364 |
| 2021 | $2,428 | $70,962 | $25,830 | $45,132 |
| 2020 | $2,355 | $72,682 | $27,370 | $45,312 |
| 2019 | $2,244 | $72,096 | $28,140 | $43,956 |
| 2018 | $2,142 | $61,875 | $18,830 | $43,045 |
| 2017 | $2,055 | $60,623 | $17,465 | $43,158 |
| 2016 | $2,003 | $59,515 | $15,400 | $44,115 |
| 2015 | $1,890 | $55,797 | $14,700 | $41,097 |
| 2014 | $1,831 | $52,433 | $12,915 | $39,518 |
| 2013 | -- | $48,384 | $10,640 | $37,744 |
Source: Public Records
Map
Nearby Homes
- 4059 Kings Row
- 3981 Regal Dr
- 3967 Kings Row
- 3996 Buckingham Square
- 5715 W Brookdale Dr
- 5554 Tappan Dr
- 3181 Sky Country Dr
- 3520 Balboa Dr
- 2195 Santona Cir
- 2210 Altamira Dr
- 3435 Balboa Dr
- 3160 Sky Country Dr
- 3235 Bryan St
- 3201 Green River Dr
- 5765 Tappan Dr
- 5455 Montego Ct
- 5420 Montego Ct
- 2130 Canyon Mesa Ct
- 1200 Wild Oak Ct
- 5950 Roxbury Ct
- 4052 Kings Row
- 4064 Kings Row
- 4048 Kings Row Unit 5
- 4044 Kings Row
- 4061 Kings Row
- 4055 Kings Row
- 4068 Kings Row
- 4065 Kings Row
- 2975 Castle Sage Ct
- 2965 Castle Sage Ct
- 4051 Kings Row
- 2980 Castle Sage Ct
- 4069 Kings Row
- 4072 Kings Row
- 4047 Kings Row
- 2945 Castle Sage Ct
- 4073 Kings Row
- 2895 Royal Crown Ct
- 2960 Castle Sage Ct
- 2885 Royal Crown Ct