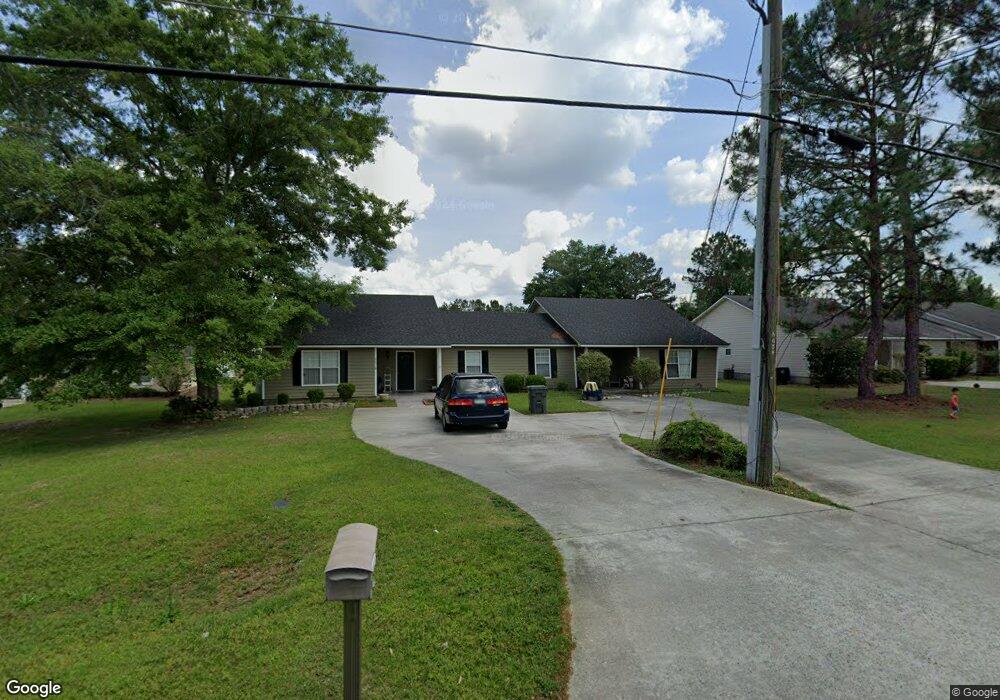
4056 Northlake Dr Unit A & B Valdosta, GA 31602
Estimated Value: $130,000 - $315,000
6
Beds
4
Baths
2,767
Sq Ft
$77/Sq Ft
Est. Value
About This Home
This home is located at 4056 Northlake Dr Unit A & B, Valdosta, GA 31602 and is currently estimated at $214,403, approximately $77 per square foot. 4056 Northlake Dr Unit A & B is a home located in Lowndes County with nearby schools including Westside Elementary School, Hahira Middle School, and Lowndes High School.
Ownership History
Date
Name
Owned For
Owner Type
Purchase Details
Closed on
Mar 5, 2025
Sold by
Hussain Zeshan
Bought by
Hussain Usman Ahmed
Current Estimated Value
Purchase Details
Closed on
Jan 14, 2025
Sold by
Ahmed Waqar
Bought by
Hussain Zeshan
Purchase Details
Closed on
Dec 14, 2020
Sold by
Bright Gregory David
Bought by
Akram Faiza and Ahmed Waqar
Home Financials for this Owner
Home Financials are based on the most recent Mortgage that was taken out on this home.
Original Mortgage
$132,000
Interest Rate
2.8%
Mortgage Type
New Conventional
Purchase Details
Closed on
Aug 12, 2010
Sold by
Jwl Investments Llc
Bought by
Bright Gregory David
Purchase Details
Closed on
Aug 8, 2000
Sold by
Evans Gerald R
Bought by
Jwl Investments Llc
Purchase Details
Closed on
Nov 17, 1998
Sold by
Bassford N L
Bought by
Evans Diversified Business Inc
Create a Home Valuation Report for This Property
The Home Valuation Report is an in-depth analysis detailing your home's value as well as a comparison with similar homes in the area
Home Values in the Area
Average Home Value in this Area
Purchase History
| Date | Buyer | Sale Price | Title Company |
|---|---|---|---|
| Hussain Usman Ahmed | -- | -- | |
| Hussain Zeshan | $124,600 | -- | |
| Akram Faiza | $165,000 | -- | |
| Bright Gregory David | $159,900 | -- | |
| Jwl Investments Llc | $140,000 | -- | |
| Evans Diversified Business Inc | -- | -- |
Source: Public Records
Mortgage History
| Date | Status | Borrower | Loan Amount |
|---|---|---|---|
| Previous Owner | Akram Faiza | $132,000 |
Source: Public Records
Tax History Compared to Growth
Tax History
| Year | Tax Paid | Tax Assessment Tax Assessment Total Assessment is a certain percentage of the fair market value that is determined by local assessors to be the total taxable value of land and additions on the property. | Land | Improvement |
|---|---|---|---|---|
| 2024 | $2,386 | $100,030 | $7,200 | $92,830 |
| 2023 | $2,386 | $93,457 | $7,200 | $86,257 |
| 2022 | $2,272 | $81,478 | $7,200 | $74,278 |
| 2021 | $1,823 | $62,626 | $7,200 | $55,426 |
| 2020 | $1,693 | $62,626 | $7,200 | $55,426 |
| 2019 | $1,711 | $62,626 | $7,200 | $55,426 |
| 2018 | $1,598 | $57,876 | $7,200 | $50,676 |
| 2017 | $1,624 | $57,876 | $7,200 | $50,676 |
| 2016 | $1,628 | $57,876 | $7,200 | $50,676 |
| 2015 | -- | $57,876 | $7,200 | $50,676 |
| 2014 | $1,633 | $59,366 | $8,800 | $50,566 |
Source: Public Records
Map
Nearby Homes
- 4107 Springruff Dr
- 4153 Springruff Dr
- 4114 Ginger Trail
- 4082 Northlake Dr
- 4268 Deercrest Dr
- 4311 Mossy Creek Rd
- Tract 1 SE I-75 Exit 22 North Valdosta Rd & Flythe Rd
- 4438 Huntington Pointe
- 3813 Winchester Place
- 4406 Forest Valley Cir
- Tract 3 SW I-75 Exit 22 Sw Shiloh Rd & Val Tech Rd
- 4728 Woodland Point
- Tract 2 SW I-75 Exit 22 Se North Valdosta Rd & Val Tech Rd
- 4311 Shiloh Trace
- 4301 Shiloh Trace
- 4616 Rain Wood Cir
- 4849 Oak Arbor Dr
- 4577 San Saba Dr
- 4593 San Saba Dr
- 0 Dasher Grove Rd
- 4052 Northlake Dr Unit B
- 4052 Northlake Dr Unit A
- 4060 Northlake Dr
- 4284 Sonoma Dr
- 4290 Sonoma Dr
- 4278 Sonoma Dr
- 4048 Northlake Dr Unit A&B
- 4294 Sonoma Dr
- 4272 Sonoma Dr
- 4266 Sonoma Dr
- 4057 Northlake Dr Unit A
- 4057 Northlake Dr Unit B
- 4057 Northlake Dr
- 4057-B Northlake Dr
- 4298 Sonoma Dr
- 4262 Sonoma Dr
- 4053 Northlake Dr Unit A
- 4053 Northlake Dr Unit B
- 4053 Northlake Dr
- 4017 Northlake Dr Unit A/B