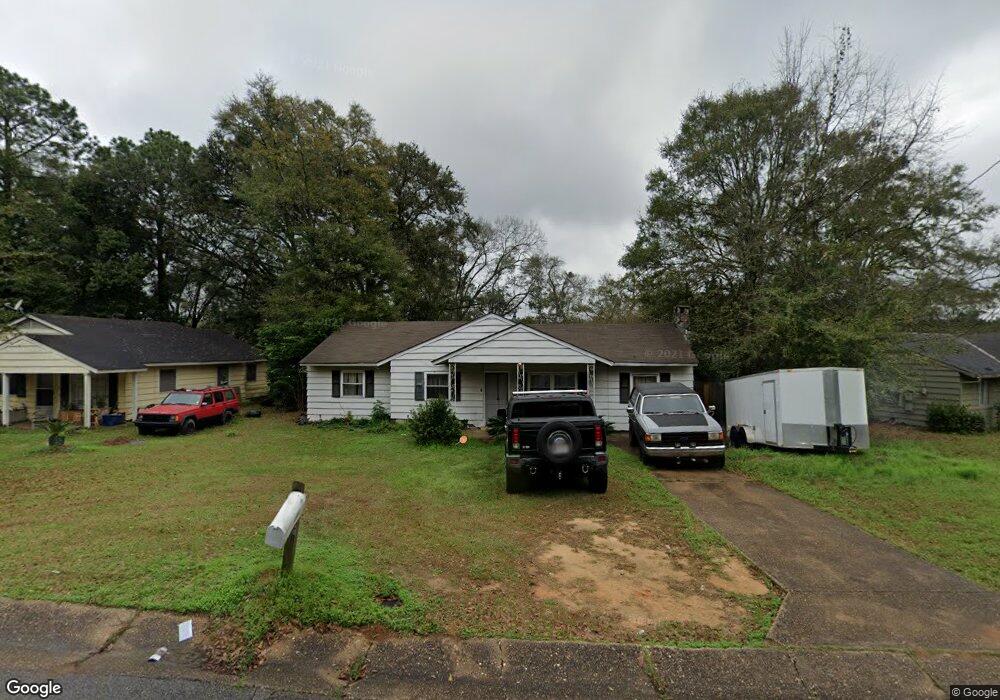
4056 Seabreeze Rd N Mobile, AL 36609
Jackson Heights NeighborhoodEstimated Value: $125,000 - $185,000
4
Beds
2
Baths
1,275
Sq Ft
$129/Sq Ft
Est. Value
About This Home
This home is located at 4056 Seabreeze Rd N, Mobile, AL 36609 and is currently estimated at $164,154, approximately $128 per square foot. 4056 Seabreeze Rd N is a home located in Mobile County with nearby schools including Elizabeth Fonde Elementary School, Elizabeth S Chastang-Fournier K-8 School, and WP Davidson High School.
Ownership History
Date
Name
Owned For
Owner Type
Purchase Details
Closed on
Jul 19, 2024
Sold by
Lambert Investments Llc and John J Investments Llc
Bought by
Douggans Norma L
Current Estimated Value
Home Financials for this Owner
Home Financials are based on the most recent Mortgage that was taken out on this home.
Original Mortgage
$152,626
Outstanding Balance
$150,789
Interest Rate
6.95%
Mortgage Type
FHA
Estimated Equity
$13,365
Purchase Details
Closed on
Feb 9, 2024
Sold by
Saucier Charles
Bought by
Lambert Investments Llc and John J Investments Llc
Purchase Details
Closed on
Aug 15, 2011
Sold by
Clearvue Opportunity Ix Llc
Bought by
Saucier Charles
Purchase Details
Closed on
Jul 29, 2010
Sold by
Lynch Annie L
Bought by
Clearvue Opportunity Ix Llc
Purchase Details
Closed on
Oct 2, 2001
Sold by
Sebastiani Ricardo
Bought by
Sebastiani Lecy S
Create a Home Valuation Report for This Property
The Home Valuation Report is an in-depth analysis detailing your home's value as well as a comparison with similar homes in the area
Home Values in the Area
Average Home Value in this Area
Purchase History
| Date | Buyer | Sale Price | Title Company |
|---|---|---|---|
| Douggans Norma L | $165,000 | Delta South Title Inc | |
| Lambert Investments Llc | $45,000 | None Listed On Document | |
| Saucier Charles | -- | Slt | |
| Clearvue Opportunity Ix Llc | $49,000 | None Available | |
| Sebastiani Lecy S | -- | -- |
Source: Public Records
Mortgage History
| Date | Status | Borrower | Loan Amount |
|---|---|---|---|
| Open | Douggans Norma L | $152,626 |
Source: Public Records
Tax History Compared to Growth
Tax History
| Year | Tax Paid | Tax Assessment Tax Assessment Total Assessment is a certain percentage of the fair market value that is determined by local assessors to be the total taxable value of land and additions on the property. | Land | Improvement |
|---|---|---|---|---|
| 2024 | $914 | $7,120 | $1,200 | $5,920 |
| 2023 | $836 | $13,000 | $2,400 | $10,600 |
| 2022 | $769 | $11,960 | $2,400 | $9,560 |
| 2021 | $718 | $11,300 | $2,200 | $9,100 |
| 2020 | $718 | $11,300 | $2,200 | $9,100 |
| 2019 | $686 | $10,800 | $0 | $0 |
| 2018 | $758 | $11,940 | $0 | $0 |
| 2017 | $758 | $11,940 | $0 | $0 |
| 2016 | $582 | $9,160 | $0 | $0 |
| 2013 | $1,006 | $9,740 | $0 | $0 |
Source: Public Records
Map
Nearby Homes
- 4107 Seabreeze Rd N
- 314 Evergreen Hill
- 417 Thornton Place
- 5120 Ridgedale Rd
- 4006 Meadow Wood Curve
- 502 Meadow Wood Curve E
- 4115 Tamworth Dr
- 363 Mcqueen Ave
- 3955 Bourgeois Dr
- 4061 Sallie Ct
- 365 Bourgeois Cir
- 4108 Bonnie Ln
- 4309 Packingham Dr
- 4317 Packingham Dr
- 409 Byron Ave E
- 4300 David St
- 308 Mcqueen Ave
- 4256 Michael Blvd
- 5305 Oak Bend Ct
- 661 Ynestra Dr
- 4058 Seabreeze Rd N
- 4054 Seabreeze Rd N
- 703 Thornton Place
- 4100 Seabreeze Rd N
- 4103 Latimer Ln
- 351 La Rose Dr
- 701 Thornton Place
- 4055 Seabreeze Rd N
- 4105 Latimer Ln
- 4102 Seabreeze Rd N
- 4053 Seabreeze Rd N
- 704 Thornton Place
- 706 Thornton Place
- 350 La Rose Dr
- 4107 Latimer Ln
- 353 La Rose Dr
- 702 Thornton Place
- 4106 Seabreeze Rd N
- 700 Thornton Place
- 4109 Latimer Ln