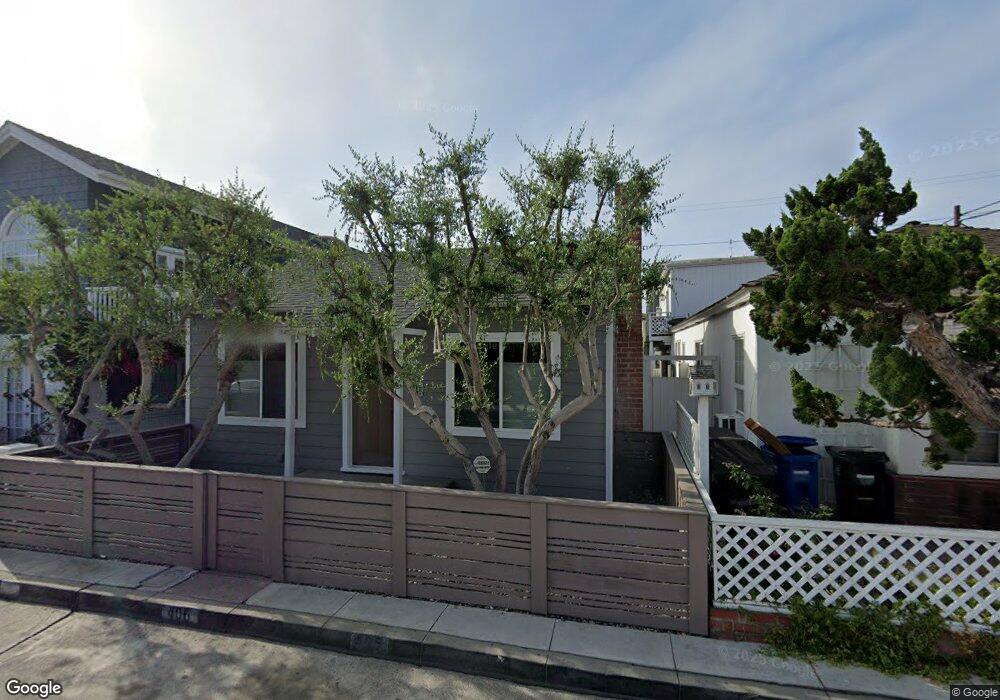
406 30th St Unit 2 Hermosa Beach, CA 90254
Estimated Value: $2,095,401 - $3,004,000
1
Bed
1
Bath
1,502
Sq Ft
$1,593/Sq Ft
Est. Value
About This Home
This home is located at 406 30th St Unit 2, Hermosa Beach, CA 90254 and is currently estimated at $2,392,850, approximately $1,593 per square foot. 406 30th St Unit 2 is a home located in Los Angeles County with nearby schools including Hermosa Valley Elementary School, Hermosa View Elementary School, and Aegean Academy.
Ownership History
Date
Name
Owned For
Owner Type
Purchase Details
Closed on
Jul 2, 2014
Sold by
Scherin Walker John and Scherin Walker Abigail
Bought by
The Chapin Family Trust
Current Estimated Value
Home Financials for this Owner
Home Financials are based on the most recent Mortgage that was taken out on this home.
Original Mortgage
$1,237,500
Outstanding Balance
$922,428
Interest Rate
3.6%
Mortgage Type
Adjustable Rate Mortgage/ARM
Estimated Equity
$1,470,422
Purchase Details
Closed on
Jun 19, 1998
Sold by
Family Trust Wray Richard And Dolores Trs Wra
Bought by
Walker John
Home Financials for this Owner
Home Financials are based on the most recent Mortgage that was taken out on this home.
Original Mortgage
$420,000
Interest Rate
6.9%
Mortgage Type
Balloon
Create a Home Valuation Report for This Property
The Home Valuation Report is an in-depth analysis detailing your home's value as well as a comparison with similar homes in the area
Home Values in the Area
Average Home Value in this Area
Purchase History
| Date | Buyer | Sale Price | Title Company |
|---|---|---|---|
| The Chapin Family Trust | $1,776,000 | Fidelity National Title Co | |
| Walker John | $525,000 | -- |
Source: Public Records
Mortgage History
| Date | Status | Borrower | Loan Amount |
|---|---|---|---|
| Open | The Chapin Family Trust | $1,237,500 | |
| Previous Owner | Walker John | $420,000 |
Source: Public Records
Tax History
| Year | Tax Paid | Tax Assessment Tax Assessment Total Assessment is a certain percentage of the fair market value that is determined by local assessors to be the total taxable value of land and additions on the property. | Land | Improvement |
|---|---|---|---|---|
| 2025 | $22,848 | $2,134,479 | $1,894,112 | $240,367 |
| 2024 | $22,848 | $2,092,627 | $1,856,973 | $235,654 |
| 2023 | $22,377 | $2,051,596 | $1,820,562 | $231,034 |
| 2022 | $21,973 | $2,011,369 | $1,784,865 | $226,504 |
| 2021 | $21,509 | $1,971,931 | $1,749,868 | $222,063 |
| 2020 | $21,386 | $1,951,713 | $1,731,926 | $219,787 |
| 2019 | $20,944 | $1,913,445 | $1,697,967 | $215,478 |
| 2018 | $20,256 | $1,875,927 | $1,664,674 | $211,253 |
| 2016 | $19,271 | $1,803,084 | $1,600,034 | $203,050 |
| 2015 | $18,832 | $1,776,000 | $1,576,000 | $200,000 |
| 2014 | $7,246 | $671,395 | $460,389 | $211,006 |
Source: Public Records
Map
Nearby Homes
- 231 Longfellow Ave
- 2919 Hermosa View Dr
- 2900 Hermosa View Dr
- 626 Longfellow Ave
- 436 1st St
- 98 Highland Ave
- 89 Bayview Dr
- 215 S Poinsettia Ave
- 207 S Poinsettia Ave
- 2526 Hermosa Ave
- 212 Manhattan Ave
- 213 Bayview Dr
- 2965 La Carlita St
- 649 Gould Terrace
- 934 1st St
- 2141 Circle Dr
- 736 Gould Ave Unit 13
- 621 6th St
- 229 7th St
- 633 21st St
Your Personal Tour Guide
Ask me questions while you tour the home.