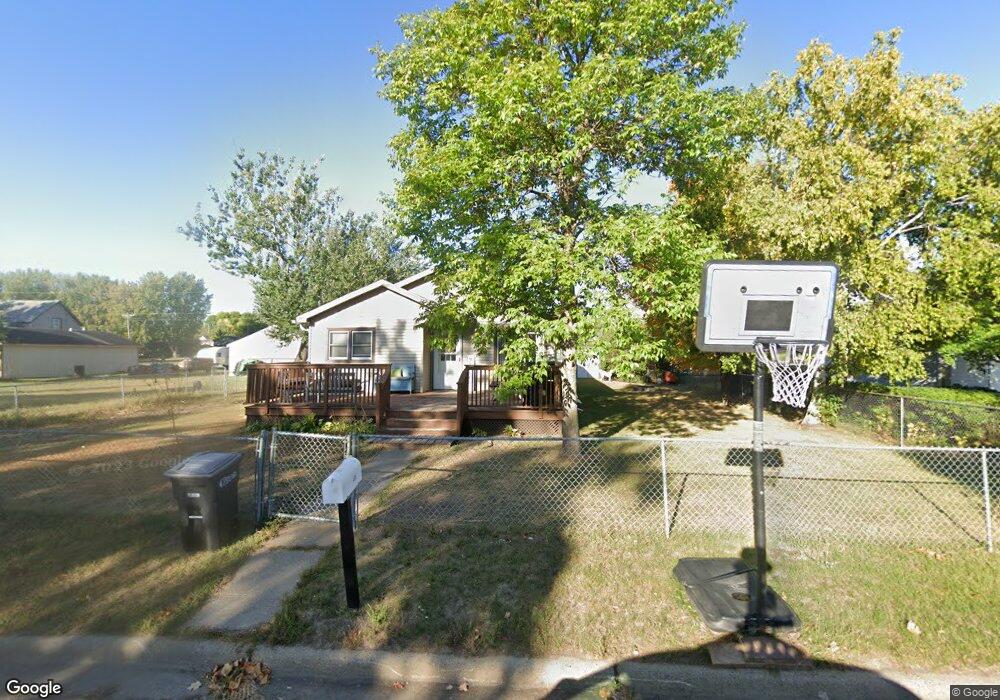
406 6th St SW Little Falls, MN 56345
Estimated Value: $233,000 - $251,458
5
Beds
2
Baths
2,026
Sq Ft
$121/Sq Ft
Est. Value
About This Home
This home is located at 406 6th St SW, Little Falls, MN 56345 and is currently estimated at $244,615, approximately $120 per square foot. 406 6th St SW is a home located in Morrison County with nearby schools including Little Falls Senior High School, Mary of Lourdes Elementary, and Mary of Lourdes School.
Ownership History
Date
Name
Owned For
Owner Type
Purchase Details
Closed on
Dec 13, 2021
Sold by
Bloom Samuel A and Bloom Kayla M
Bought by
Herman Carrie
Current Estimated Value
Home Financials for this Owner
Home Financials are based on the most recent Mortgage that was taken out on this home.
Original Mortgage
$169,973
Outstanding Balance
$156,056
Interest Rate
2.98%
Mortgage Type
New Conventional
Estimated Equity
$88,559
Purchase Details
Closed on
Jan 29, 2016
Bought by
Bloom Samuel Samuel
Home Financials for this Owner
Home Financials are based on the most recent Mortgage that was taken out on this home.
Original Mortgage
$72,600
Interest Rate
3.79%
Create a Home Valuation Report for This Property
The Home Valuation Report is an in-depth analysis detailing your home's value as well as a comparison with similar homes in the area
Home Values in the Area
Average Home Value in this Area
Purchase History
| Date | Buyer | Sale Price | Title Company |
|---|---|---|---|
| Herman Carrie | $173,112 | Larson Abstract Co Inc | |
| Bloom Samuel Samuel | $73,600 | -- |
Source: Public Records
Mortgage History
| Date | Status | Borrower | Loan Amount |
|---|---|---|---|
| Open | Herman Carrie | $169,973 | |
| Previous Owner | Bloom Samuel Samuel | $72,600 |
Source: Public Records
Tax History Compared to Growth
Tax History
| Year | Tax Paid | Tax Assessment Tax Assessment Total Assessment is a certain percentage of the fair market value that is determined by local assessors to be the total taxable value of land and additions on the property. | Land | Improvement |
|---|---|---|---|---|
| 2025 | $2,354 | $227,100 | $16,000 | $211,100 |
| 2024 | $2,282 | $181,300 | $16,000 | $165,300 |
| 2023 | $2,282 | $176,500 | $14,000 | $162,500 |
| 2022 | $1,552 | $145,700 | $14,000 | $131,700 |
| 2021 | $1,722 | $125,500 | $13,200 | $112,300 |
| 2020 | $1,564 | $368,000 | $39,600 | $328,400 |
| 2019 | $1,534 | $121,000 | $13,200 | $107,800 |
| 2018 | $1,446 | $113,000 | $13,200 | $99,800 |
| 2017 | $1,274 | $107,400 | $13,200 | $94,200 |
| 2016 | $1,212 | $0 | $0 | $0 |
| 2014 | $1,126 | $0 | $0 | $0 |
| 2013 | $1,126 | $0 | $0 | $0 |
Source: Public Records
Map
Nearby Homes