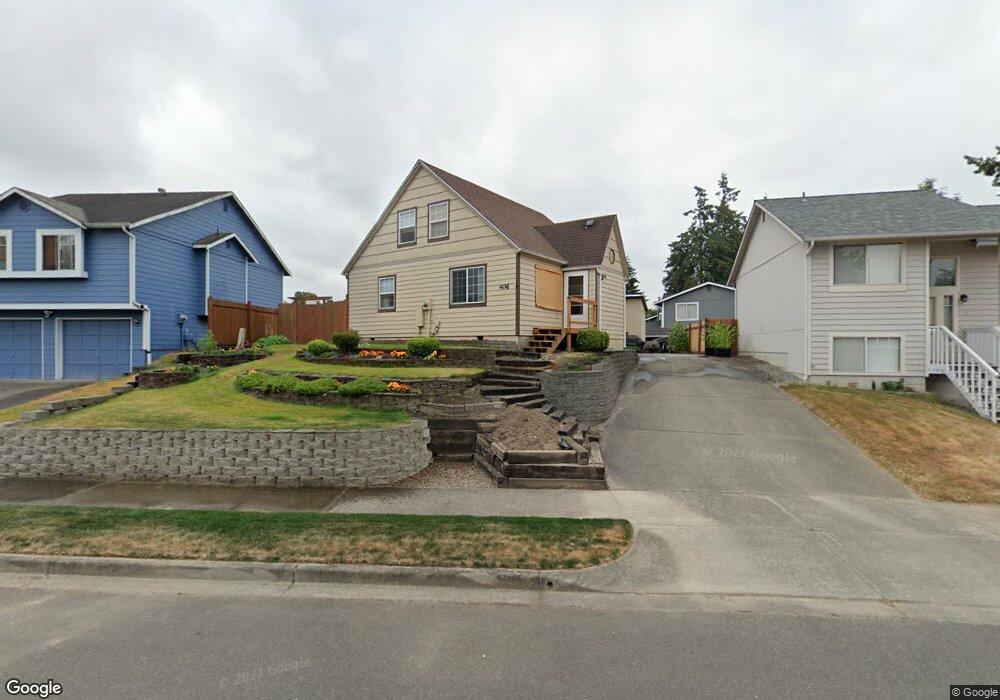
406 E 53rd St Tacoma, WA 98404
Eastside NeighborhoodEstimated Value: $389,509 - $428,000
3
Beds
1
Bath
1,250
Sq Ft
$331/Sq Ft
Est. Value
About This Home
This home is located at 406 E 53rd St, Tacoma, WA 98404 and is currently estimated at $413,877, approximately $331 per square foot. 406 E 53rd St is a home located in Pierce County with nearby schools including Oakland High School, Hunt Middle School, and Lincoln High School.
Ownership History
Date
Name
Owned For
Owner Type
Purchase Details
Closed on
Jun 25, 2019
Sold by
Mccord Sharon Kaye
Bought by
Rlt Mccord Sharon Kaye and Rlt Sharon Kaye Mccord
Current Estimated Value
Purchase Details
Closed on
Aug 7, 2003
Sold by
Welter Rex A
Bought by
Mccord Sharon K
Purchase Details
Closed on
Mar 16, 1994
Sold by
Va
Bought by
Welter Rex A
Home Financials for this Owner
Home Financials are based on the most recent Mortgage that was taken out on this home.
Original Mortgage
$70,600
Interest Rate
7.21%
Mortgage Type
Seller Take Back
Purchase Details
Closed on
Nov 23, 1993
Sold by
Seattle Mtg Company
Bought by
Va
Purchase Details
Closed on
Nov 19, 1993
Sold by
H & L Services Inc
Bought by
Seattle Mtg Company
Create a Home Valuation Report for This Property
The Home Valuation Report is an in-depth analysis detailing your home's value as well as a comparison with similar homes in the area
Home Values in the Area
Average Home Value in this Area
Purchase History
| Date | Buyer | Sale Price | Title Company |
|---|---|---|---|
| Rlt Mccord Sharon Kaye | -- | None Available | |
| Mccord Sharon K | $124,900 | Transnation Title Ins Co | |
| Welter Rex A | -- | Transamerica Title Ins Co | |
| Va | -- | Chicago Title | |
| Seattle Mtg Company | -- | -- |
Source: Public Records
Mortgage History
| Date | Status | Borrower | Loan Amount |
|---|---|---|---|
| Previous Owner | Welter Rex A | $70,600 |
Source: Public Records
Tax History
| Year | Tax Paid | Tax Assessment Tax Assessment Total Assessment is a certain percentage of the fair market value that is determined by local assessors to be the total taxable value of land and additions on the property. | Land | Improvement |
|---|---|---|---|---|
| 2025 | $3,401 | $331,700 | $183,500 | $148,200 |
| 2024 | $3,401 | $321,900 | $173,300 | $148,600 |
| 2023 | $3,401 | $305,100 | $164,800 | $140,300 |
| 2022 | $3,466 | $357,700 | $187,800 | $169,900 |
| 2021 | $3,069 | $243,900 | $111,800 | $132,100 |
| 2019 | $248 | $218,600 | $93,500 | $125,100 |
| 2018 | $264 | $194,300 | $75,100 | $119,200 |
| 2017 | $284 | $171,800 | $62,300 | $109,500 |
| 2016 | $296 | $126,700 | $46,100 | $80,600 |
| 2014 | $157 | $118,700 | $45,500 | $73,200 |
| 2013 | $157 | $107,700 | $39,900 | $67,800 |
Source: Public Records
Map
Nearby Homes
Your Personal Tour Guide
Ask me questions while you tour the home.