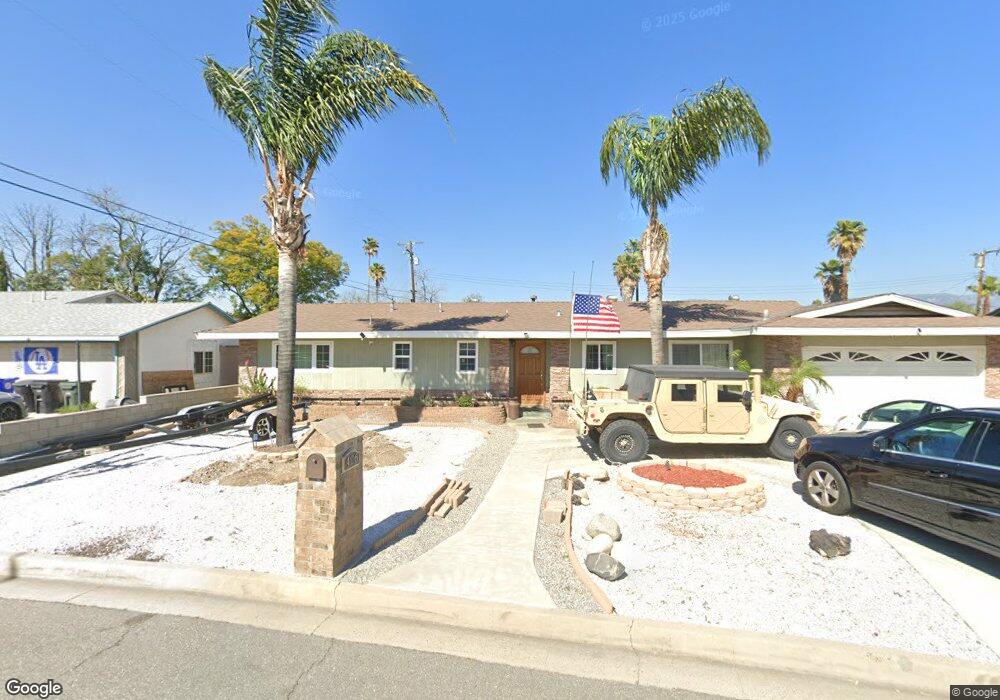
406 E Margarita Rd Rialto, CA 92376
Estimated Value: $552,000 - $605,000
3
Beds
2
Baths
1,456
Sq Ft
$389/Sq Ft
Est. Value
About This Home
This home is located at 406 E Margarita Rd, Rialto, CA 92376 and is currently estimated at $566,469, approximately $389 per square foot. 406 E Margarita Rd is a home located in San Bernardino County with nearby schools including Morgan Elementary School, Frisbie Middle School, and Eisenhower High School.
Ownership History
Date
Name
Owned For
Owner Type
Purchase Details
Closed on
Jul 5, 2018
Sold by
Hawkins Liliana Lia
Bought by
Hawkins Liliana Lia and Hawkins Michael R
Current Estimated Value
Purchase Details
Closed on
Aug 2, 2017
Sold by
Hawkins Liliana L and Simmons Liliana L
Bought by
Hawkins Liliana L
Purchase Details
Closed on
Nov 30, 2004
Sold by
Simmons Liliana L
Bought by
Simmons Liliana L
Home Financials for this Owner
Home Financials are based on the most recent Mortgage that was taken out on this home.
Original Mortgage
$165,650
Interest Rate
5.65%
Mortgage Type
New Conventional
Purchase Details
Closed on
May 9, 2002
Sold by
Etzweiler Gordon and Etzweiler Sondra
Bought by
Lester Mark S and Lester Ruth E
Create a Home Valuation Report for This Property
The Home Valuation Report is an in-depth analysis detailing your home's value as well as a comparison with similar homes in the area
Home Values in the Area
Average Home Value in this Area
Purchase History
| Date | Buyer | Sale Price | Title Company |
|---|---|---|---|
| Hawkins Liliana Lia | -- | None Available | |
| Hawkins Liliana L | -- | None Available | |
| Simmons Liliana L | -- | Stewart Title Company | |
| Lester Mark S | $125,000 | First American Title Co |
Source: Public Records
Mortgage History
| Date | Status | Borrower | Loan Amount |
|---|---|---|---|
| Closed | Simmons Liliana L | $165,650 |
Source: Public Records
Tax History
| Year | Tax Paid | Tax Assessment Tax Assessment Total Assessment is a certain percentage of the fair market value that is determined by local assessors to be the total taxable value of land and additions on the property. | Land | Improvement |
|---|---|---|---|---|
| 2025 | $2,100 | $167,741 | $41,958 | $125,783 |
| 2024 | $2,027 | $164,452 | $41,135 | $123,317 |
| 2023 | $2,162 | $161,227 | $40,328 | $120,899 |
| 2022 | $2,007 | $158,065 | $39,537 | $118,528 |
| 2021 | $1,994 | $154,966 | $38,762 | $116,204 |
| 2020 | $2,008 | $153,377 | $38,365 | $115,012 |
| 2019 | $1,962 | $150,370 | $37,613 | $112,757 |
| 2018 | $1,904 | $147,421 | $36,875 | $110,546 |
| 2017 | $1,890 | $144,530 | $36,152 | $108,378 |
| 2016 | $1,869 | $141,696 | $35,443 | $106,253 |
| 2015 | $1,877 | $139,568 | $34,911 | $104,657 |
| 2014 | $1,766 | $136,834 | $34,227 | $102,607 |
Source: Public Records
Map
Nearby Homes
- 1335 N Magnolia Ave
- 0 N Acacia Ave Unit CV25094258
- 251 E Scott St
- 932 N Encina Ave
- 1431 N Eucalyptus Ave
- 723 E Shamrock St
- 822 E Virginia St
- 160 W Cascade Dr
- 866 N Eucalyptus Ave
- 242 W Jackson St
- 1270 N Rosalind Ave
- 917 E Jackson St
- 979 N Gardena Ave
- 1423 Terrace Rd
- 1790 N Encina Ave
- 133 E Van Koevering St
- 178 W Walnut Ave Unit D
- 332 E Rosewood St
- 470 W Jackson St
- 538 N Oakdale Ave
- 418 E Margarita Rd
- 394 E Margarita Rd
- 405 E Mariposa Dr
- 417 E Mariposa Dr
- 395 E Mariposa Dr
- 430 E Margarita Rd
- 382 E Margarita Rd
- 407 E Margarita Rd
- 395 E Margarita Rd
- 419 E Margarita Rd
- 383 E Mariposa Dr
- 383 E Margarita Rd
- 442 E Margarita Rd
- 433 E Margarita Rd
- 370 E Margarita Rd
- 441 E Mariposa Dr
- 371 E Mariposa Dr
- 371 E Margarita Rd
- 406 E Mariposa Dr
- 447 E Margarita Rd
Your Personal Tour Guide
Ask me questions while you tour the home.