A
Seller's Agent in 2015
Alice Jolley
Coldwell Banker Walden & Kirkland

Estimated Value: $144,000 - $227,000
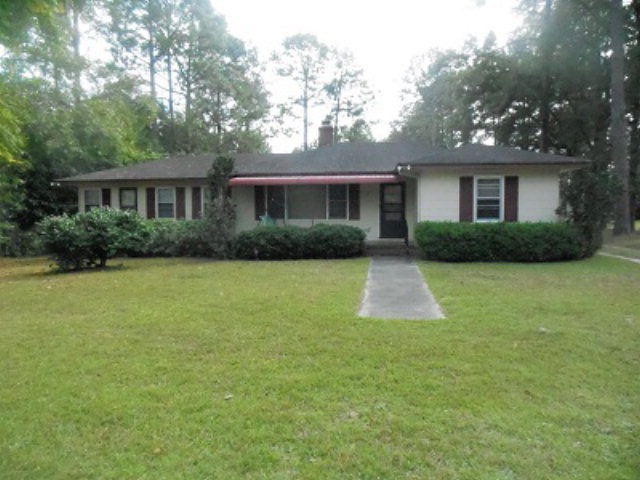
WOW! This is the home you have been looking for in Sylvester! New paint, 3 bedrooms, 2 bathrooms home with beautiful hardwood floors in all rooms except bedroom, bathrooms, and kitchen. Paneled tongue and groove in bedroom/sitting room. Large kitchen/dining room. Gorgeous hardwood ceilings throughout home! Sunroom on back. Front porch to sit and rock in your favorite rocking chair. New Electrical update throughout the entire home. New HVAC Gas Unit. New Plumbing clean-out installed in the front yard. Wired workshop with open extension in back to store your play toys. MOTIVATED SELLER! Large lot for plenty of room to enjoy the outdoors.
Last Agent to Sell the Property
Alice Jolley
Coldwell Banker Walden & Kirkland Brokerage Phone: 2294368811 Listed on: 05/18/2015
Last Buyer's Agent
Alice Jolley
Coldwell Banker Walden & Kirkland Brokerage Phone: 2294368811 Listed on: 05/18/2015
| Date | Buyer | Sale Price | Title Company |
|---|---|---|---|
| Jefferson Marvin | $78,000 | -- | |
| Toles Lillian W | $97,500 | -- | |
| Chambless Robert | $91,000 | -- |
| Date | Status | Borrower | Loan Amount |
|---|---|---|---|
| Open | Jefferson Marvin | $74,100 | |
| Previous Owner | Toles Lillian W | $78,000 | |
| Previous Owner | Chambless Robert | $89,594 |
| Date | Event | Price | List to Sale | Price per Sq Ft |
|---|---|---|---|---|
| 06/12/2015 06/12/15 | Sold | $78,000 | -- | $49 / Sq Ft |
| 05/18/2015 05/18/15 | Pending | -- | -- | -- |
| Year | Tax Paid | Tax Assessment Tax Assessment Total Assessment is a certain percentage of the fair market value that is determined by local assessors to be the total taxable value of land and additions on the property. | Land | Improvement |
|---|---|---|---|---|
| 2025 | $2,018 | $73,574 | $10,000 | $63,574 |
| 2024 | $1,179 | $31,926 | $5,645 | $26,281 |
| 2023 | $1,179 | $31,926 | $5,645 | $26,281 |
| 2022 | $1,148 | $31,926 | $5,645 | $26,281 |
| 2021 | $1,146 | $31,926 | $5,645 | $26,281 |
| 2020 | $1,148 | $31,926 | $5,645 | $26,281 |
| 2019 | $1,146 | $31,926 | $5,645 | $26,281 |
| 2018 | $1,082 | $31,926 | $5,645 | $26,281 |
| 2017 | $1,082 | $31,926 | $5,645 | $26,281 |
| 2016 | $1,120 | $31,926 | $5,645 | $26,281 |
| 2015 | $1,084 | $31,926 | $5,645 | $26,281 |
| 2014 | $1,084 | $31,926 | $5,645 | $26,281 |
| 2013 | -- | $31,926 | $5,645 | $26,281 |
| 2012 | -- | $31,925 | $5,644 | $26,280 |
A
Seller's Agent in 2015
Alice Jolley
Coldwell Banker Walden & Kirkland
Source: Albany Board of REALTORS®
MLS Number: 133481
APN: SV120-043-000
Ask me questions while you tour the home.