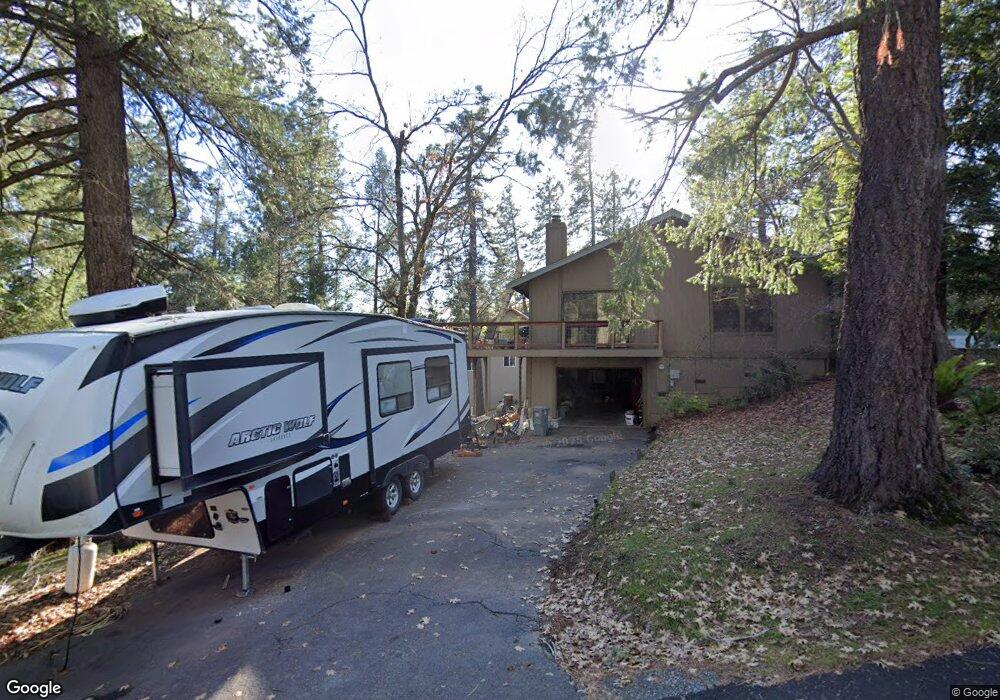
406 Manzanita Way Colfax, CA 95713
Estimated Value: $236,000 - $341,000
3
Beds
1
Bath
944
Sq Ft
$308/Sq Ft
Est. Value
About This Home
This home is located at 406 Manzanita Way, Colfax, CA 95713 and is currently estimated at $290,943, approximately $308 per square foot. 406 Manzanita Way is a home located in Placer County with nearby schools including Colfax Elementary School, Colfax High School, and Chicago Park Community Charter School.
Ownership History
Date
Name
Owned For
Owner Type
Purchase Details
Closed on
Aug 20, 2021
Sold by
Walker Riva Jane
Bought by
Sonnenfelt Betty Jo and Burgess Polly Ann
Current Estimated Value
Home Financials for this Owner
Home Financials are based on the most recent Mortgage that was taken out on this home.
Original Mortgage
$168,800
Outstanding Balance
$153,260
Interest Rate
2.8%
Mortgage Type
New Conventional
Estimated Equity
$137,683
Purchase Details
Closed on
Aug 19, 2021
Sold by
Sonnenfelt Betty Jo and Burgess Polly Ann
Bought by
Cinnamon Daniel and Cinnamon Glendy Fuertez
Home Financials for this Owner
Home Financials are based on the most recent Mortgage that was taken out on this home.
Original Mortgage
$168,800
Outstanding Balance
$153,260
Interest Rate
2.8%
Mortgage Type
New Conventional
Estimated Equity
$137,683
Purchase Details
Closed on
Oct 21, 1994
Sold by
Walker Pansy J
Bought by
Sonnenfelt Betty Jo and Burgess Polly Ann
Purchase Details
Closed on
Oct 17, 1994
Sold by
Walker Riva J
Bought by
Walker Riva J
Create a Home Valuation Report for This Property
The Home Valuation Report is an in-depth analysis detailing your home's value as well as a comparison with similar homes in the area
Home Values in the Area
Average Home Value in this Area
Purchase History
| Date | Buyer | Sale Price | Title Company |
|---|---|---|---|
| Sonnenfelt Betty Jo | -- | Placer Title Company | |
| Cinnamon Daniel | $211,000 | Placer Title Company | |
| Sonnenfelt Betty Jo | -- | -- | |
| Walker Riva J | -- | -- |
Source: Public Records
Mortgage History
| Date | Status | Borrower | Loan Amount |
|---|---|---|---|
| Open | Cinnamon Daniel | $168,800 |
Source: Public Records
Tax History Compared to Growth
Tax History
| Year | Tax Paid | Tax Assessment Tax Assessment Total Assessment is a certain percentage of the fair market value that is determined by local assessors to be the total taxable value of land and additions on the property. | Land | Improvement |
|---|---|---|---|---|
| 2025 | $2,106 | $210,000 | $74,600 | $135,400 |
| 2023 | $2,106 | $204,000 | $72,500 | $131,500 |
| 2022 | $2,233 | $211,000 | $75,000 | $136,000 |
| 2021 | $270 | $22,850 | $6,332 | $16,518 |
| 2020 | $266 | $22,617 | $6,268 | $16,349 |
| 2019 | $261 | $22,175 | $6,146 | $16,029 |
| 2018 | $252 | $21,741 | $6,026 | $15,715 |
| 2017 | $321 | $21,315 | $5,908 | $15,407 |
| 2016 | $316 | $20,898 | $5,793 | $15,105 |
| 2015 | $310 | $20,585 | $5,706 | $14,879 |
| 2014 | $307 | $20,183 | $5,595 | $14,588 |
Source: Public Records
Map
Nearby Homes
- 320 Pleasant St
- 0 Kneeland St Unit 225109849
- 9 Rising Sun Rd
- 15 Sunset Ave
- 230 Rising Sun Rd
- 208 Rising Sun Rd
- 150 W Oak St
- 24580 View Cape Horn Ave
- 147 Scholtz Ave
- 309 S Auburn St
- 30 Lincoln St
- 38 Lincoln St
- 895 Sunray Ln
- 34 Washington
- 1333 California 174
- 24275 Grand View Ave
- 212 Glendale Rd
- 1333 Pinecroft Rd
- 155 Whitcomb Ave
- 70 Iowa Hill Rd