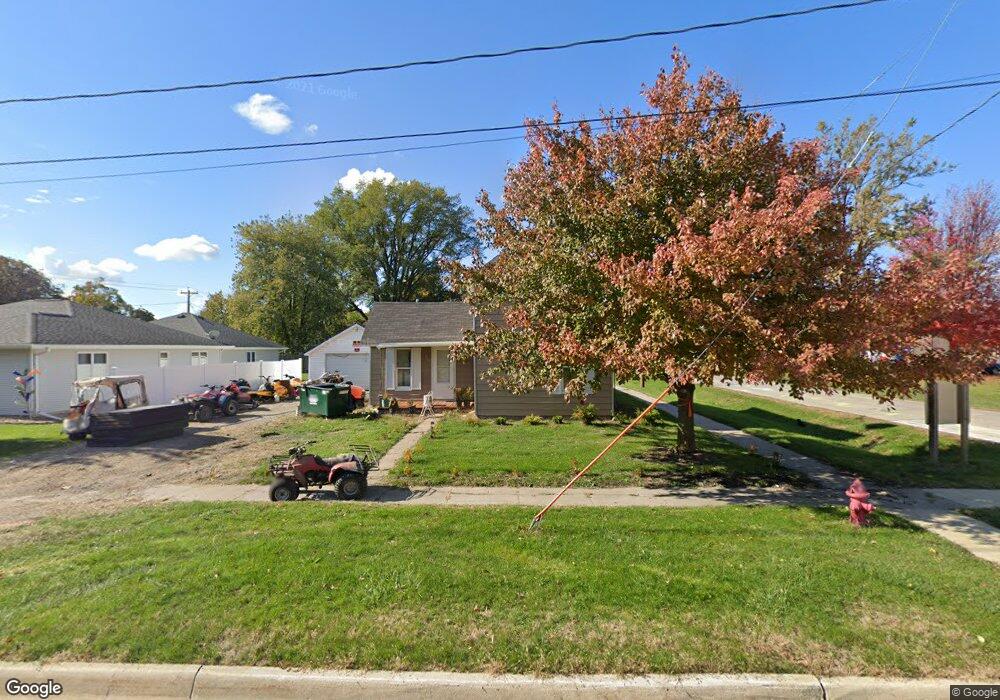
406 N 3rd St Montezuma, IA 50171
Estimated Value: $56,000 - $192,000
2
Beds
1
Bath
832
Sq Ft
$128/Sq Ft
Est. Value
About This Home
This home is located at 406 N 3rd St, Montezuma, IA 50171 and is currently estimated at $106,848, approximately $128 per square foot. 406 N 3rd St is a home located in Poweshiek County with nearby schools including Montezuma Elementary School and Montezuma Junior High School.
Ownership History
Date
Name
Owned For
Owner Type
Purchase Details
Closed on
Aug 21, 2020
Sold by
County Bank
Bought by
Blondeau Christopher M
Current Estimated Value
Home Financials for this Owner
Home Financials are based on the most recent Mortgage that was taken out on this home.
Original Mortgage
$23,059
Outstanding Balance
$12,200
Interest Rate
3%
Mortgage Type
New Conventional
Estimated Equity
$94,648
Purchase Details
Closed on
Jul 31, 2006
Sold by
Lyddon Richard and Lyddon Patricia M
Bought by
Oliver Bryan S and Oliver Teresa K
Create a Home Valuation Report for This Property
The Home Valuation Report is an in-depth analysis detailing your home's value as well as a comparison with similar homes in the area
Home Values in the Area
Average Home Value in this Area
Purchase History
| Date | Buyer | Sale Price | Title Company |
|---|---|---|---|
| Blondeau Christopher M | $25,000 | None Available | |
| Oliver Bryan S | $42,000 | None Available |
Source: Public Records
Mortgage History
| Date | Status | Borrower | Loan Amount |
|---|---|---|---|
| Open | Blondeau Christopher M | $23,059 | |
| Closed | Oliver Bryan S | $0 |
Source: Public Records
Tax History Compared to Growth
Tax History
| Year | Tax Paid | Tax Assessment Tax Assessment Total Assessment is a certain percentage of the fair market value that is determined by local assessors to be the total taxable value of land and additions on the property. | Land | Improvement |
|---|---|---|---|---|
| 2025 | $606 | $71,110 | $14,260 | $56,850 |
| 2024 | $642 | $41,380 | $12,670 | $28,710 |
| 2023 | $632 | $41,380 | $12,670 | $28,710 |
| 2022 | $618 | $33,730 | $10,070 | $23,660 |
| 2021 | $618 | $31,820 | $9,500 | $22,320 |
| 2020 | $534 | $31,820 | $9,500 | $22,320 |
| 2019 | $550 | $28,260 | $9,500 | $18,760 |
| 2018 | $544 | $28,260 | $9,500 | $18,760 |
| 2017 | $522 | $28,260 | $9,500 | $18,760 |
| 2016 | $540 | $28,260 | $9,500 | $18,760 |
| 2015 | -- | $28,260 | $9,500 | $18,760 |
| 2014 | -- | $28,260 | $9,500 | $18,760 |
Source: Public Records
Map
Nearby Homes