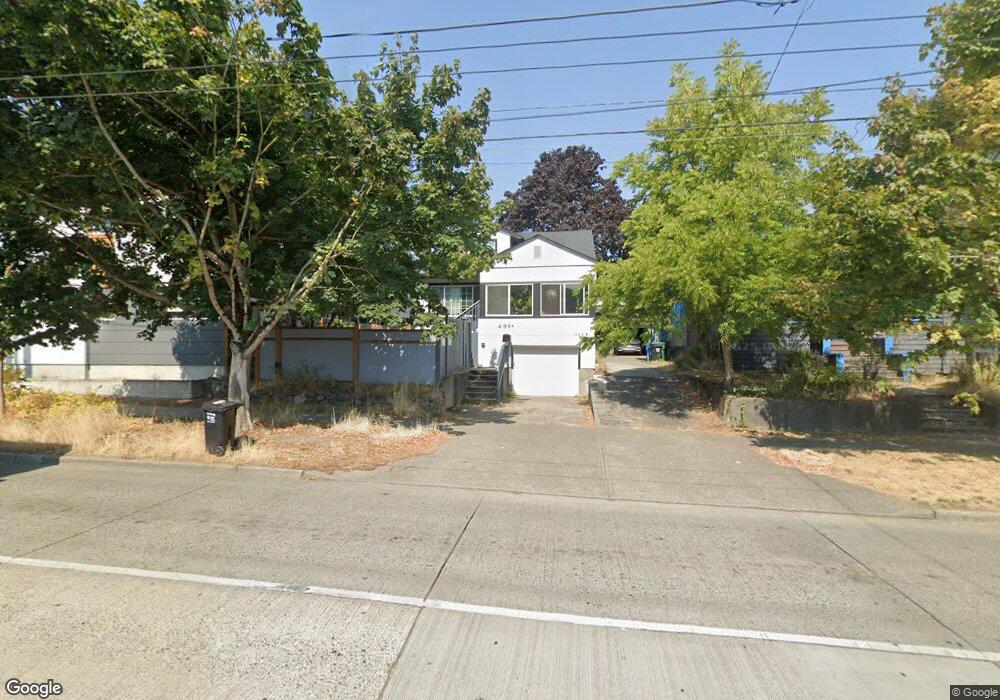
406 N 46th St Unit 101 Seattle, WA 98103
Fremont NeighborhoodEstimated Value: $376,568 - $489,000
1
Bed
1
Bath
557
Sq Ft
$740/Sq Ft
Est. Value
About This Home
This home is located at 406 N 46th St Unit 101, Seattle, WA 98103 and is currently estimated at $412,392, approximately $740 per square foot. 406 N 46th St Unit 101 is a home located in King County with nearby schools including West Woodland Elementary School, Hamilton International Middle School, and Lincoln High School.
Ownership History
Date
Name
Owned For
Owner Type
Purchase Details
Closed on
Mar 14, 2005
Sold by
Marshall Andrew
Bought by
Theriot Tina M
Current Estimated Value
Home Financials for this Owner
Home Financials are based on the most recent Mortgage that was taken out on this home.
Original Mortgage
$37,690
Outstanding Balance
$19,095
Interest Rate
5.6%
Mortgage Type
Credit Line Revolving
Estimated Equity
$393,297
Purchase Details
Closed on
Nov 27, 2002
Sold by
Auld Suzanne K and Auld Christopher J
Bought by
Marshall Andrew
Home Financials for this Owner
Home Financials are based on the most recent Mortgage that was taken out on this home.
Original Mortgage
$170,200
Interest Rate
6.28%
Purchase Details
Closed on
Aug 1, 2000
Sold by
Crown Development Company Inc
Bought by
Auld Christopher J and Boots Suzanne K
Home Financials for this Owner
Home Financials are based on the most recent Mortgage that was taken out on this home.
Original Mortgage
$120,000
Interest Rate
8.14%
Create a Home Valuation Report for This Property
The Home Valuation Report is an in-depth analysis detailing your home's value as well as a comparison with similar homes in the area
Home Values in the Area
Average Home Value in this Area
Purchase History
| Date | Buyer | Sale Price | Title Company |
|---|---|---|---|
| Theriot Tina M | $188,450 | Commonwealth L | |
| Marshall Andrew | $175,400 | Chicago Title | |
| Auld Christopher J | $160,000 | Evergreen Title Company Inc |
Source: Public Records
Mortgage History
| Date | Status | Borrower | Loan Amount |
|---|---|---|---|
| Open | Theriot Tina M | $37,690 | |
| Open | Theriot Tina M | $150,760 | |
| Previous Owner | Marshall Andrew | $170,200 | |
| Previous Owner | Auld Christopher J | $120,000 |
Source: Public Records
Tax History Compared to Growth
Tax History
| Year | Tax Paid | Tax Assessment Tax Assessment Total Assessment is a certain percentage of the fair market value that is determined by local assessors to be the total taxable value of land and additions on the property. | Land | Improvement |
|---|---|---|---|---|
| 2024 | $3,371 | $348,000 | $195,300 | $152,700 |
| 2023 | $3,089 | $391,000 | $191,100 | $199,900 |
| 2022 | $3,285 | $362,000 | $191,100 | $170,900 |
| 2021 | $3,448 | $356,000 | $191,100 | $164,900 |
| 2020 | $3,724 | $356,000 | $182,800 | $173,200 |
| 2018 | $3,281 | $376,000 | $132,900 | $243,100 |
| 2017 | $2,641 | $332,000 | $116,300 | $215,700 |
| 2016 | $2,272 | $275,000 | $108,000 | $167,000 |
| 2015 | $1,920 | $230,000 | $91,400 | $138,600 |
| 2014 | -- | $198,000 | $78,900 | $119,100 |
| 2013 | -- | $150,000 | $70,600 | $79,400 |
Source: Public Records
Map
Nearby Homes
- 4507 Phinney Ave N
- 511 N 46th St Unit A
- 506 N 45th St Unit 301
- 4421 Greenwood Ave N Unit A203
- 4503 Palatine Ave N
- 4501 Fremont Ave N
- 303 N 44th St Unit 105
- 4324 Phinney Ave N Unit 1
- 4320 Palatine Ave N
- 4500 1st Ave NW
- 4333 Evanston Ave N
- 4303 Dayton Ave N Unit E
- 4309 Evanston Ave N
- 4903 Linden Ave N Unit 3
- 464 N 42nd St
- 816 N 43rd St
- 4130 Palatine Ave N
- 972 N Allen Place
- 4306 3rd Ave NW
- 322 NW 47th St Unit C
- 406 N 46th St Unit 301
- 406 N 46th St Unit 202
- 406 N 46th St
- 406 N 46th St Unit 201
- 406 N 46th St Unit 302
- 4606 Phinney Ave N
- 4604 Phinney Ave N
- 410 N 46th St
- 4600 Phinney Ave N
- 402 N 46th St
- 4602 Phinney Ave N
- 4612 Phinney Ave N
- 414 N 46th St
- 415 N 47th St
- 418 N 46th St
- 4616 Phinney Ave N
- 4613 Dayton Ave N Unit ID1035935P
- 4613 Dayton Ave N
- 401 N 46th St
- 417 N 47th St