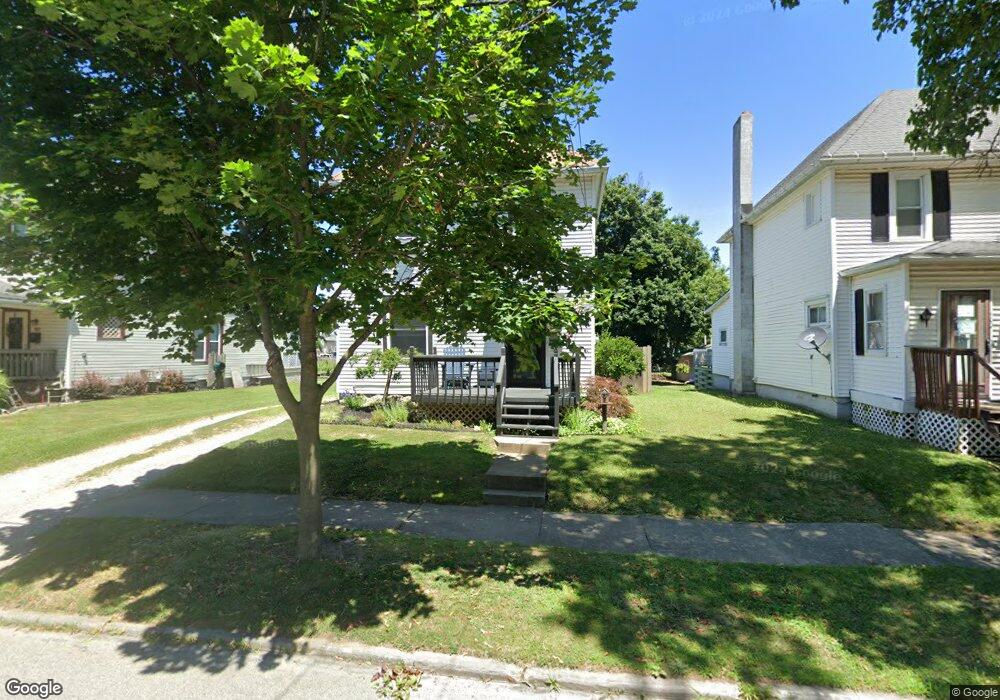
406 Ohio St Ashland, OH 44805
Estimated Value: $116,863 - $136,000
3
Beds
1
Bath
1,056
Sq Ft
$119/Sq Ft
Est. Value
About This Home
This home is located at 406 Ohio St, Ashland, OH 44805 and is currently estimated at $125,466, approximately $118 per square foot. 406 Ohio St is a home located in Ashland County with nearby schools including Ashland High School, Ashland County Community Academy, and St. Edward Elementary School.
Ownership History
Date
Name
Owned For
Owner Type
Purchase Details
Closed on
Jan 24, 2024
Sold by
Weitzel Jill R
Bought by
Boeh Bethany A
Current Estimated Value
Purchase Details
Closed on
Jun 17, 2013
Sold by
Price Gloria L
Bought by
Weitzel Jill R and Boeh Bethany A
Purchase Details
Closed on
Nov 6, 2001
Sold by
Markley Kevin J
Bought by
Weitzel Jill R
Purchase Details
Closed on
Apr 5, 2001
Sold by
Price Gloria Lynn
Bought by
Markley Kevin J
Purchase Details
Closed on
Aug 8, 1994
Bought by
Price Gloria Lynn
Create a Home Valuation Report for This Property
The Home Valuation Report is an in-depth analysis detailing your home's value as well as a comparison with similar homes in the area
Home Values in the Area
Average Home Value in this Area
Purchase History
| Date | Buyer | Sale Price | Title Company |
|---|---|---|---|
| Boeh Bethany A | $19,500 | None Listed On Document | |
| Weitzel Jill R | $70,000 | -- | |
| Weitzel Jill R | $70,000 | -- | |
| Markley Kevin J | $42,500 | -- | |
| Price Gloria Lynn | $34,000 | -- |
Source: Public Records
Tax History Compared to Growth
Tax History
| Year | Tax Paid | Tax Assessment Tax Assessment Total Assessment is a certain percentage of the fair market value that is determined by local assessors to be the total taxable value of land and additions on the property. | Land | Improvement |
|---|---|---|---|---|
| 2024 | $947 | $27,390 | $6,910 | $20,480 |
| 2023 | $947 | $27,390 | $6,910 | $20,480 |
| 2022 | $888 | $20,290 | $5,120 | $15,170 |
| 2021 | $891 | $20,290 | $5,120 | $15,170 |
| 2020 | $844 | $20,290 | $5,120 | $15,170 |
| 2019 | $729 | $16,200 | $5,820 | $10,380 |
| 2018 | $735 | $16,200 | $5,820 | $10,380 |
| 2017 | $738 | $16,200 | $5,820 | $10,380 |
| 2016 | $701 | $14,730 | $5,290 | $9,440 |
| 2015 | $695 | $14,730 | $5,290 | $9,440 |
| 2013 | $1,004 | $20,950 | $5,220 | $15,730 |
Source: Public Records
Map
Nearby Homes