Estimated Value: $313,742 - $409,000
--
Bed
--
Bath
2,028
Sq Ft
$175/Sq Ft
Est. Value
About This Home
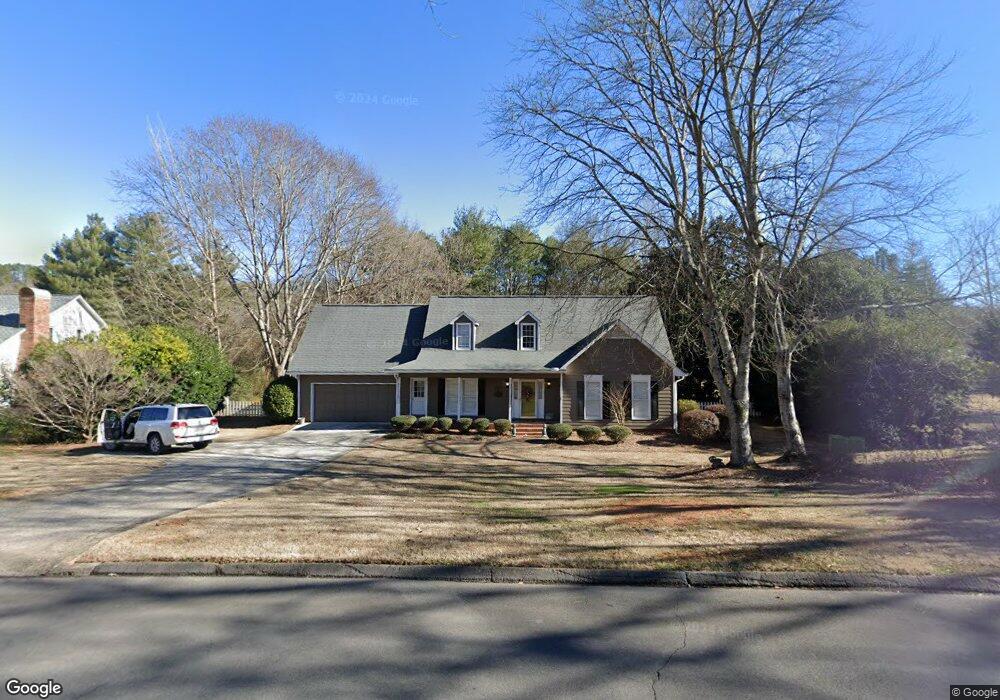
This home is located at 406 Pheasant Run SE, Rome, GA 30161 and is currently estimated at $355,436, approximately $175 per square foot. 406 Pheasant Run SE is a home located in Floyd County with nearby schools including Rome High School, Montessori School of Rome, and St. Mary School.
Ownership History
Date
Name
Owned For
Owner Type
Purchase Details
Closed on
Jun 12, 2025
Sold by
Milam Craig E
Bought by
Roberson Mollie M
Current Estimated Value
Home Financials for this Owner
Home Financials are based on the most recent Mortgage that was taken out on this home.
Original Mortgage
$12,000
Outstanding Balance
$11,969
Interest Rate
6.81%
Mortgage Type
New Conventional
Estimated Equity
$343,467
Purchase Details
Closed on
Oct 20, 2015
Sold by
Milam Ann L and Milam Robert Eugene
Bought by
Milam Robert Eugene
Purchase Details
Closed on
Feb 23, 2015
Sold by
Milam Ann L
Bought by
Milam Ann L and Milam Robert Eugene
Purchase Details
Closed on
Jun 24, 2010
Sold by
Milam Robert E
Bought by
Milam Ann L
Purchase Details
Closed on
Mar 26, 1987
Sold by
Dooley James Ross
Bought by
Milam Robert E and Milam Ann L
Purchase Details
Closed on
Jun 17, 1985
Sold by
N R S Properties Inc
Bought by
Dooley James Ross
Purchase Details
Closed on
Jan 30, 1973
Bought by
N R S Properties Inc
Create a Home Valuation Report for This Property
The Home Valuation Report is an in-depth analysis detailing your home's value as well as a comparison with similar homes in the area
Home Values in the Area
Average Home Value in this Area
Purchase History
| Date | Buyer | Sale Price | Title Company |
|---|---|---|---|
| Roberson Mollie M | -- | -- | |
| Milam Robert Eugene | -- | -- | |
| Milam Ann L | -- | -- | |
| Milam Ann L | -- | -- | |
| Milam Robert E | -- | -- | |
| Dooley James Ross | $15,000 | -- | |
| N R S Properties Inc | -- | -- |
Source: Public Records
Mortgage History
| Date | Status | Borrower | Loan Amount |
|---|---|---|---|
| Open | Roberson Mollie M | $12,000 |
Source: Public Records
Tax History Compared to Growth
Tax History
| Year | Tax Paid | Tax Assessment Tax Assessment Total Assessment is a certain percentage of the fair market value that is determined by local assessors to be the total taxable value of land and additions on the property. | Land | Improvement |
|---|---|---|---|---|
| 2024 | $2,541 | $118,468 | $26,558 | $91,910 |
| 2023 | $2,520 | $116,629 | $23,762 | $92,867 |
| 2022 | $2,249 | $98,338 | $19,569 | $78,769 |
| 2021 | $2,146 | $90,228 | $18,171 | $72,057 |
| 2020 | $2,083 | $85,476 | $13,978 | $71,498 |
| 2019 | $1,884 | $75,479 | $13,978 | $61,501 |
| 2018 | $1,780 | $69,524 | $13,978 | $55,546 |
| 2017 | $1,724 | $66,694 | $13,978 | $52,716 |
| 2016 | $1,845 | $72,840 | $13,960 | $58,880 |
| 2015 | $1,660 | $69,120 | $13,960 | $55,160 |
| 2014 | $1,660 | $70,536 | $13,960 | $56,576 |
Source: Public Records
Map
Nearby Homes
- 519 Dr SE
- 3 Belmont Ct SE
- 15 Saddlebrook Dr SE
- 211 Chateau Dr SE
- 52 Twickenham Rd SE
- 333 Alfred Ave SE
- 0 Wellington Way SE Unit 7374604
- 0 Wellington Way SE Unit 7374602
- 0 Wellington Way SE Unit 20180069
- 0 Wellington Way SE Unit 20180068
- 36 Coventry Dr SE
- 327 Flora Ave SE
- 18 Wellington Way SE
- 226 Flora Ave SE
- 35 Cumberland Dr SE
- 409 Flora Ave SE
- 22 Coventry Dr SE
- 20 Coventry Dr SE
- 2812 Maple Rd SE
- 3010 Maple Rd SE
- 408 Pheasant Run SE
- 0 Rockmart Hwy Unit 8400125
- 0 Rockmart Hwy Unit 2760816
- 0 Rockmart Hwy Unit 3004682
- 0 Rockmart Hwy Unit 7080391
- 0 Rockmart Hwy Unit 7029854
- 0 Rockmart Hwy Unit 7423036
- 0 Rockmart Hwy Unit 7419465
- 0 Rockmart Hwy Unit 8116509
- 0 Rockmart Hwy SE Unit 4173721
- 0 Rockmart Hwy Unit 5189035
- 0 Rockmart Hwy Unit 5512710
- 0 Rockmart Hwy Unit 5510135
- 0 Rockmart Hwy Unit 7196322
- 0 Rockmart Hwy Unit 7196279
- 0 Rockmart Hwy SE Unit 3004682
- 0 Rockmart Hwy Unit 8116507
- 0 Rockmart Hwy Unit 8669346
- 0 Rockmart Hwy Unit 3146109
- 0 Rockmart Hwy SE Unit 7080391