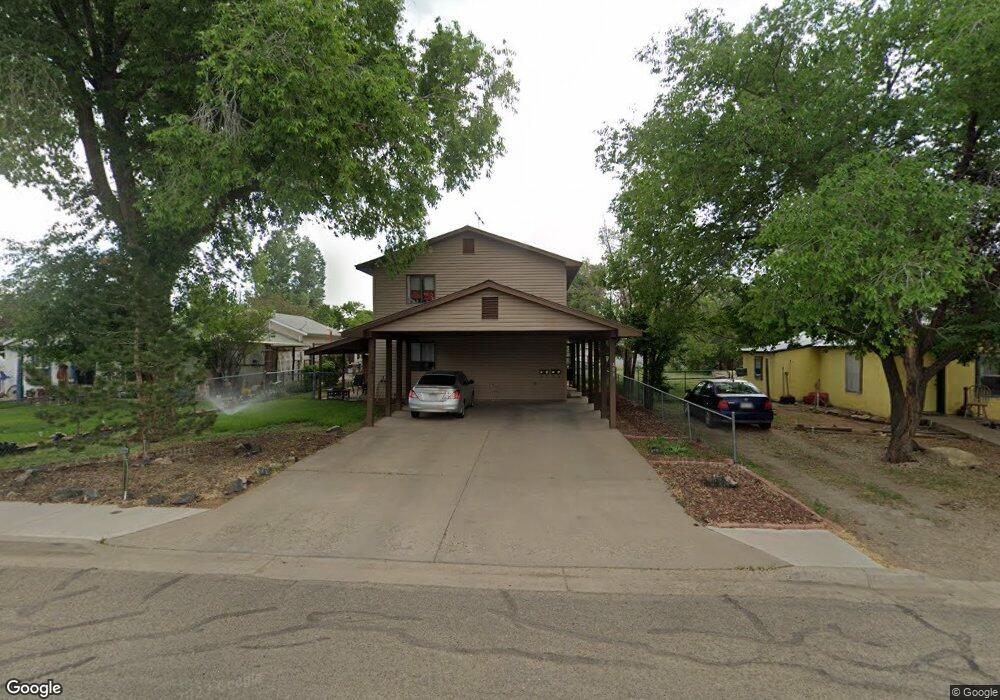
406 S Maple St Cortez, CO 81321
Estimated Value: $274,000 - $364,000
Studio
3
Baths
1,872
Sq Ft
$164/Sq Ft
Est. Value
About This Home
This home is located at 406 S Maple St, Cortez, CO 81321 and is currently estimated at $306,336, approximately $163 per square foot. 406 S Maple St is a home located in Montezuma County with nearby schools including Montezuma-Cortez High School, Children's Kiva Montessori School, and Children's Kiva Montessori Preschool & Kindergarten.
Ownership History
Date
Name
Owned For
Owner Type
Purchase Details
Closed on
Nov 6, 2018
Sold by
Christina Aaldering Serbiene Maria
Bought by
Aaldering Serbiene
Current Estimated Value
Purchase Details
Closed on
Oct 30, 2017
Sold by
Harper James E and Harper Sharon M
Bought by
Christina Aaldering Serbiene Maria
Home Financials for this Owner
Home Financials are based on the most recent Mortgage that was taken out on this home.
Original Mortgage
$144,750
Outstanding Balance
$121,069
Interest Rate
3.78%
Mortgage Type
New Conventional
Estimated Equity
$185,267
Purchase Details
Closed on
Mar 13, 2017
Sold by
Lance Ronald C and Lance Mary Kay
Bought by
Meyer Christopher L
Purchase Details
Closed on
Jul 29, 1993
Sold by
Dahl David C and Dahl Karen M
Bought by
Harper James E and Harper Sharon M
Create a Home Valuation Report for This Property
The Home Valuation Report is an in-depth analysis detailing your home's value as well as a comparison with similar homes in the area
Purchase History
| Date | Buyer | Sale Price | Title Company |
|---|---|---|---|
| Aaldering Serbiene | -- | None Available | |
| Aaldering Serbiene | -- | None Available | |
| Christina Aaldering Serbiene Maria | $193,000 | Old Republic Title | |
| Meyer Christopher L | $172,000 | Colorado Title & Closing Ser | |
| Harper James E | $75,000 | -- |
Source: Public Records
Mortgage History
| Date | Status | Borrower | Loan Amount |
|---|---|---|---|
| Open | Christina Aaldering Serbiene Maria | $144,750 |
Source: Public Records
Tax History
| Year | Tax Paid | Tax Assessment Tax Assessment Total Assessment is a certain percentage of the fair market value that is determined by local assessors to be the total taxable value of land and additions on the property. | Land | Improvement |
|---|---|---|---|---|
| 2024 | $1,079 | $14,432 | $1,899 | $12,533 |
| 2023 | $742 | $18,809 | $2,475 | $16,334 |
| 2022 | $600 | $12,673 | $1,130 | $11,543 |
| 2021 | $624 | $12,673 | $1,130 | $11,543 |
| 2020 | $560 | $11,829 | $1,243 | $10,586 |
| 2019 | $562 | $11,829 | $1,243 | $10,586 |
| 2018 | $686 | $10,760 | $1,120 | $9,640 |
| 2017 | $682 | $10,760 | $1,120 | $9,640 |
| 2016 | $587 | $10,210 | $1,240 | $8,970 |
| 2015 | $538 | $148,750 | $0 | $0 |
| 2014 | $627 | $10,210 | $0 | $0 |
Source: Public Records
Map
Nearby Homes
- 420 W 4th St
- 210 W 3rd St Unit 4
- 520 W 6th St Unit 15
- 317 S Chestnut St
- 209 S Chestnut St
- 501 S Market St
- 431 Juniper Place
- 511 Juniper Place
- 526 Juniper Place
- 500 S Market St
- 706 S Cedar St
- 530 Juniper Place
- 821 S Chestnut St
- 144 S Market St
- 313 S Broadway
- 16 W 10th St
- 8 W 10th St
- 608 Alameda Dr
- 770 Stratton Dr
- 122 E 1st St Unit see broker remarks
Your Personal Tour Guide
Ask me questions while you tour the home.